

87
We can infer from these results that allometric equations for mangrove plants in
Southeast Asia are highly species-specific but less site-specific.
Published estimates of mangrove aboveground biomass vary from <10 t ha
−1
to
>600 t ha
−1
(Paijmans and Rollet 1977; Putz and Chan 1986; Komiyama et al. 1988;
Donato et al. 2011). This wide range of values reflects the fact that mangrove plants
have a great deal of form plasticity depending on their environment. Further, analyses of mangrove biomass data from forests growing at various latitudes (Twilley
et al. 1992; Saenger and Snedaker 1993; Hutchison et al. 2014) have reported a
more or less linear decline in aboveground biomass with increasing latitude.
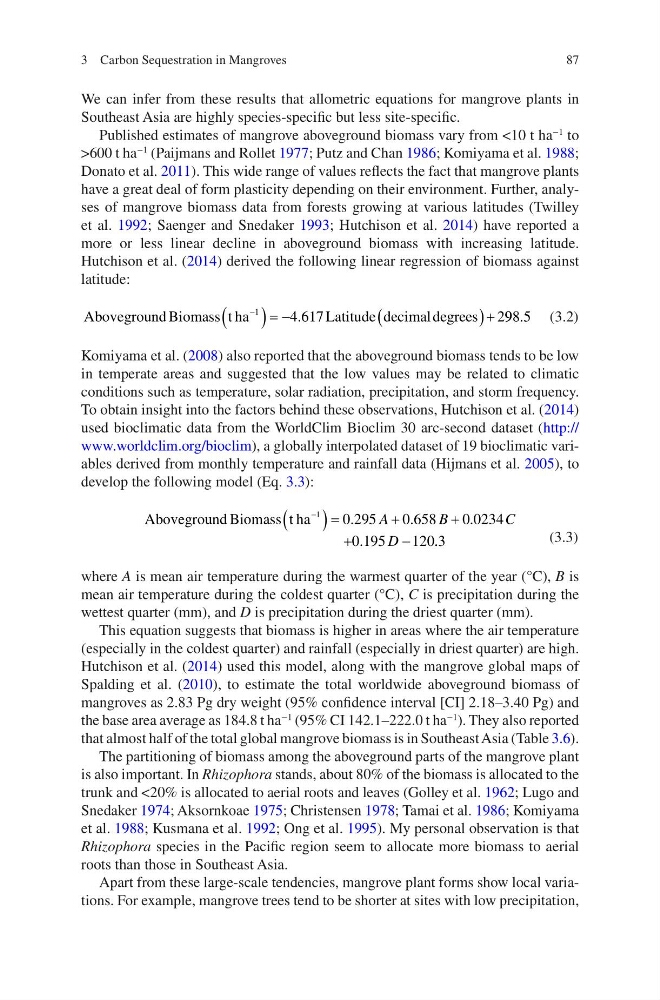
Hutchison et al. (2014) derived the following linear regression of biomass against
latitude:
Aboveground Biomass t ha
Latitude decimal degrees
-
( ) = -
(
) +
1
4 617
2
.
9 98 5
.
(3.2)
Komiyama et al. (2008) also reported that the aboveground biomass tends to be low
in temperate areas and suggested that the low values may be related to climatic
conditions such as temperature, solar radiation, precipitation, and storm frequency.
To obtain insight into the factors behind these observations, Hutchison et al. (2014)
used bioclimatic data from the WorldClim Bioclim 30 arc-second dataset (http://
www.worldclim.org/bioclim), a globally interpolated dataset of 19 bioclimatic variables derived from monthly temperature and rainfall data (Hijmans et al. 2005), to
develop the following model (Eq. 3.3):
Aboveground Biomass t ha
-
( ) =
+
+
+
-
1
0 295
0 658
0 0234
0 195
120
.
.
.
.
A
B
C
D
. .3
(3.3)
where A is mean air temperature during the warmest quarter of the year (°C), B is
mean air temperature during the coldest quarter (°C), C is precipitation during the
wettest quarter (mm), and D is precipitation during the driest quarter (mm).
This equation suggests that biomass is higher in areas where the air temperature
(especially in the coldest quarter) and rainfall (especially in driest quarter) are high.
Hutchison et al. (2014) used this model, along with the mangrove global maps of
Spalding et al. (2010), to estimate the total worldwide aboveground biomass of
mangroves as 2.83 Pg dry weight (95% confidence interval [CI] 2.18–3.40 Pg) and
the base area average as 184.8 t ha
−1
(95% CI 142.1–222.0 t ha
−1
). They also reported
that almost half of the total global mangrove biomass is in Southeast Asia (Table 3.6).
The partitioning of biomass among the aboveground parts of the mangrove plant
is also important. In Rhizophora stands, about 80% of the biomass is allocated to the
trunk and <20% is allocated to aerial roots and leaves (Golley et al. 1962; Lugo and
Snedaker 1974; Aksornkoae 1975; Christensen 1978; Tamai et al. 1986; Komiyama
et al. 1988; Kusmana et al. 1992; Ong et al. 1995). My personal observation is that
Rhizophora species in the Pacific region seem to allocate more biomass to aerial
roots than those in Southeast Asia.
Apart from these large-scale tendencies, mangrove plant forms show local variations. For example, mangrove trees tend to be shorter at sites with low precipitation,
3 Carbon Sequestration in Mangroves
We can infer from these results that allometric equations for mangrove plants in
Southeast Asia are highly species-specific but less site-specific.
Published estimates of mangrove aboveground biomass vary from <10 t ha
−1
to
>600 t ha
−1
(Paijmans and Rollet 1977; Putz and Chan 1986; Komiyama et al. 1988;
Donato et al. 2011). This wide range of values reflects the fact that mangrove plants
have a great deal of form plasticity depending on their environment. Further, analyses of mangrove biomass data from forests growing at various latitudes (Twilley
et al. 1992; Saenger and Snedaker 1993; Hutchison et al. 2014) have reported a
more or less linear decline in aboveground biomass with increasing latitude.
Hutchison et al. (2014) derived the following linear regression of biomass against
latitude:
Aboveground Biomass t ha
Latitude decimal degrees
-
( ) = -
(
) +
1
4 617
2
.
9 98 5
.
(3.2)
Komiyama et al. (2008) also reported that the aboveground biomass tends to be low
in temperate areas and suggested that the low values may be related to climatic
conditions such as temperature, solar radiation, precipitation, and storm frequency.
To obtain insight into the factors behind these observations, Hutchison et al. (2014)
used bioclimatic data from the WorldClim Bioclim 30 arc-second dataset (http://
www.worldclim.org/bioclim), a globally interpolated dataset of 19 bioclimatic variables derived from monthly temperature and rainfall data (Hijmans et al. 2005), to
develop the following model (Eq. 3.3):
Aboveground Biomass t ha
-
( ) =
+
+
+
-
1
0 295
0 658
0 0234
0 195
120
.
.
.
.
A
B
C
D
. .3
(3.3)
where A is mean air temperature during the warmest quarter of the year (°C), B is
mean air temperature during the coldest quarter (°C), C is precipitation during the
wettest quarter (mm), and D is precipitation during the driest quarter (mm).
This equation suggests that biomass is higher in areas where the air temperature
(especially in the coldest quarter) and rainfall (especially in driest quarter) are high.
Hutchison et al. (2014) used this model, along with the mangrove global maps of
Spalding et al. (2010), to estimate the total worldwide aboveground biomass of
mangroves as 2.83 Pg dry weight (95% confidence interval [CI] 2.18–3.40 Pg) and
the base area average as 184.8 t ha
−1
(95% CI 142.1–222.0 t ha
−1
). They also reported
that almost half of the total global mangrove biomass is in Southeast Asia (Table 3.6).
The partitioning of biomass among the aboveground parts of the mangrove plant
is also important. In Rhizophora stands, about 80% of the biomass is allocated to the
trunk and <20% is allocated to aerial roots and leaves (Golley et al. 1962; Lugo and
Snedaker 1974; Aksornkoae 1975; Christensen 1978; Tamai et al. 1986; Komiyama
et al. 1988; Kusmana et al. 1992; Ong et al. 1995). My personal observation is that
Rhizophora species in the Pacific region seem to allocate more biomass to aerial
roots than those in Southeast Asia.
Apart from these large-scale tendencies, mangrove plant forms show local variations. For example, mangrove trees tend to be shorter at sites with low precipitation,
3 Carbon Sequestration in Mangroves