

58
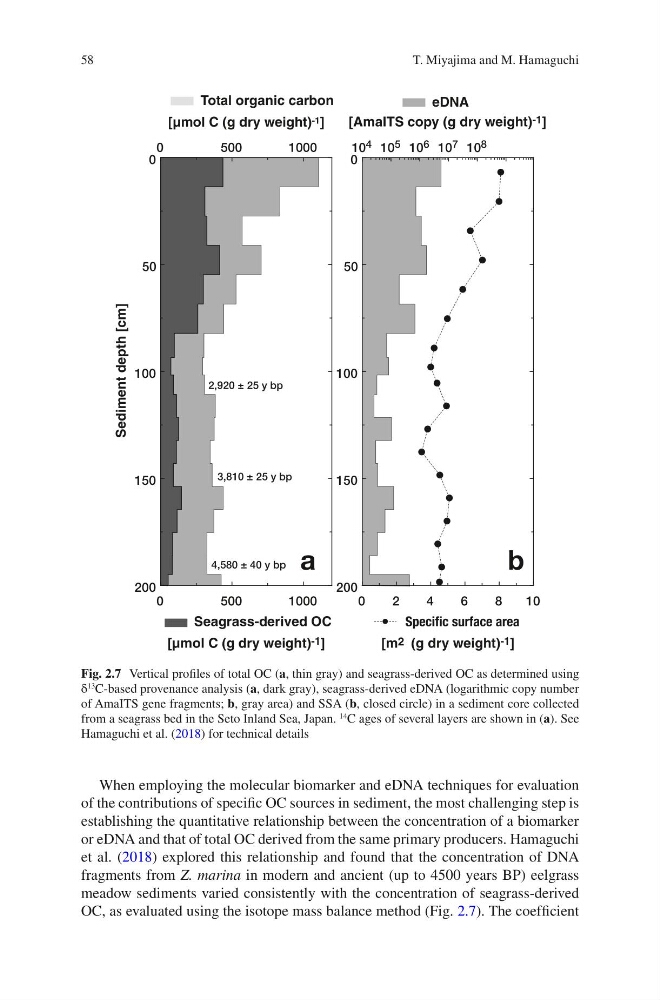
When employing the molecular biomarker and eDNA techniques for evaluation
of the contributions of specific OC sources in sediment, the most challenging step is
establishing the quantitative relationship between the concentration of a biomarker
or eDNA and that of total OC derived from the same primary producers. Hamaguchi
et al. (2018) explored this relationship and found that the concentration of DNA
fragments from Z. marina in modern and ancient (up to 4500 years BP) eelgrass
meadow sediments varied consistently with the concentration of seagrass-derived
OC, as evaluated using the isotope mass balance method (Fig. 2.7). The coefficient
0
500
1000
0
500
1000
0
50
100
150
200
Sediment depth [cm]
Total organic carbon
[µmol C (g dry weight) -1 ]
Seagrass-derived OC
[µmol C (g dry weight) -1 ]
0
2
4
6
8
10
10 4 10 5 10 6 10 7 10 8
0
50
100
150
200
eDNA
[AmaITS copy (g dry weight) -1 ]
[m 2 (g dry weight) -1 ]
a
b
4,580 ± 40 y bp
3,810 ± 25 y bp
2,920 ± 25 y bp
Fig. 2.7 Vertical profiles of total OC (a, thin gray) and seagrass-derived OC as determined using
δ
13 C-based provenance analysis (a, dark gray), seagrass-derived eDNA (logarithmic copy number
of AmaITS gene fragments; b, gray area) and SSA (b, closed circle) in a sediment core collected
from a seagrass bed in the Seto Inland Sea, Japan.
14 C ages of several layers are shown in (a). See
Hamaguchi et al. (2018) for technical details
T. Miyajima and M. Hamaguchi
When employing the molecular biomarker and eDNA techniques for evaluation
of the contributions of specific OC sources in sediment, the most challenging step is
establishing the quantitative relationship between the concentration of a biomarker
or eDNA and that of total OC derived from the same primary producers. Hamaguchi
et al. (2018) explored this relationship and found that the concentration of DNA
fragments from Z. marina in modern and ancient (up to 4500 years BP) eelgrass
meadow sediments varied consistently with the concentration of seagrass-derived
OC, as evaluated using the isotope mass balance method (Fig. 2.7). The coefficient
0
500
1000
0
500
1000
0
50
100
150
200
Sediment depth [cm]
Total organic carbon
[µmol C (g dry weight) -1 ]
Seagrass-derived OC
[µmol C (g dry weight) -1 ]
0
2
4
6
8
10
10 4 10 5 10 6 10 7 10 8
0
50
100
150
200
eDNA
[AmaITS copy (g dry weight) -1 ]
[m 2 (g dry weight) -1 ]
a
b
4,580 ± 40 y bp
3,810 ± 25 y bp
2,920 ± 25 y bp
Fig. 2.7 Vertical profiles of total OC (a, thin gray) and seagrass-derived OC as determined using
δ
13 C-based provenance analysis (a, dark gray), seagrass-derived eDNA (logarithmic copy number
of AmaITS gene fragments; b, gray area) and SSA (b, closed circle) in a sediment core collected
from a seagrass bed in the Seto Inland Sea, Japan.
14 C ages of several layers are shown in (a). See
Hamaguchi et al. (2018) for technical details
T. Miyajima and M. Hamaguchi