
C3
P351 lines 17–21:
Another explanation is that the estimate of major contributors to the large exchange
rate, namely, mangroves (mean, –336 Tg C year
–1
) and tidal marshes (mean, –661Tg
C year
–1
), have already been implicitly included in the global estimate of the terrestrial CO 2 exchange rate (–2,300 ± 700 Tg C year
–1
).
has been revised to
Another explanation is that the estimate of major contributors to the large exchange
rate, namely, mangroves (mean, –336 Tg C year
–1
) and tidal marshes (mean, –66 Tg
C year
–1
), have already been implicitly included in the global estimate of the terrestrial CO 2 exchange rate (–2,300 ± 700 Tg C year
–1
).
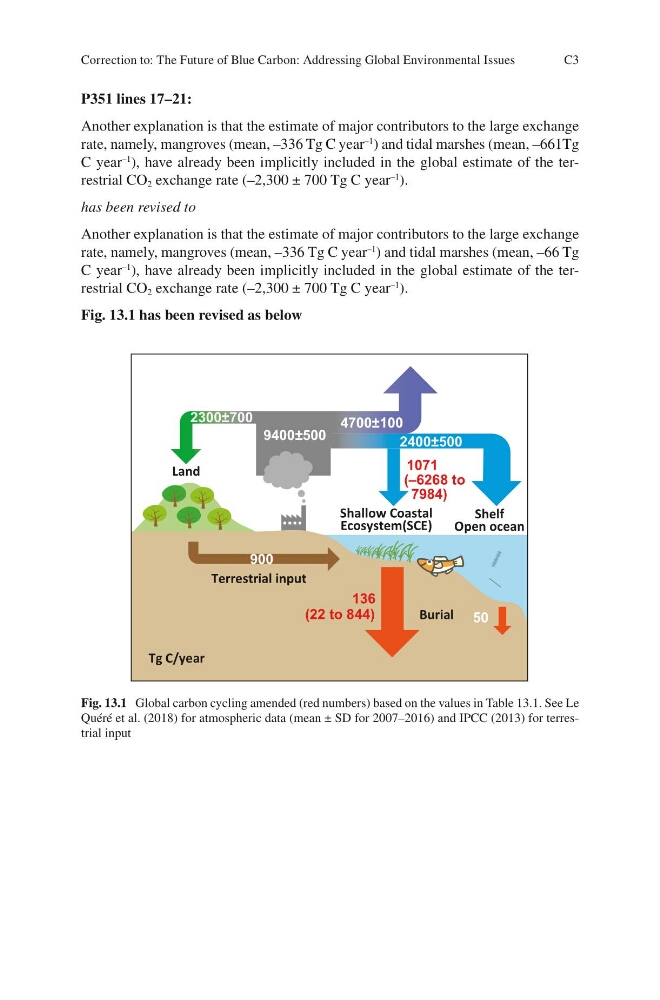
Fig. 13.1 has been revised as below
9400±500
2300±700
4700±100
2400±500
900
136
50
Land
Shallow Coastal
Ecosystem(SCE)
Terrestrial input
Shelf
Open ocean
Burial
Tg C/year
(22 to 844)
1071
(–6268 to
7984)
Fig. 13.1 Global carbon cycling amended (red numbers) based on the values in Table 13.1. See Le
Quéré et al. (2018) for atmospheric data (mean ± SD for 2007–2016) and IPCC (2013) for terrestrial input
Correction to: The Future of Blue Carbon: Addressing Global Environmental Issues
P351 lines 17–21:
Another explanation is that the estimate of major contributors to the large exchange
rate, namely, mangroves (mean, –336 Tg C year
–1
) and tidal marshes (mean, –661Tg
C year
–1
), have already been implicitly included in the global estimate of the terrestrial CO 2 exchange rate (–2,300 ± 700 Tg C year
–1
).
has been revised to
Another explanation is that the estimate of major contributors to the large exchange
rate, namely, mangroves (mean, –336 Tg C year
–1
) and tidal marshes (mean, –66 Tg
C year
–1
), have already been implicitly included in the global estimate of the terrestrial CO 2 exchange rate (–2,300 ± 700 Tg C year
–1
).
Fig. 13.1 has been revised as below
9400±500
2300±700
4700±100
2400±500
900
136
50
Land
Shallow Coastal
Ecosystem(SCE)
Terrestrial input
Shelf
Open ocean
Burial
Tg C/year
(22 to 844)
1071
(–6268 to
7984)
Fig. 13.1 Global carbon cycling amended (red numbers) based on the values in Table 13.1. See Le
Quéré et al. (2018) for atmospheric data (mean ± SD for 2007–2016) and IPCC (2013) for terrestrial input
Correction to: The Future of Blue Carbon: Addressing Global Environmental Issues
Précédent