

354
2. Establishing new measurement techniques for the carbon stocks and flows that
researchers have not been able to quantify via conventional methods, especially
for seasonal fluctuation of macrophyte biomass and the amount that drifts, as
well as the formation of refractory dissolved organic matter in SCEs (Wada et al.
2008; Orr 2014; Hill et al. 2015; Krause-Jensen and Duarte 2016; Duarte and
Krause-Jensen 2017; Abo et al. 2018; Jiao et al. 2018). It is also necessary to
elucidate the underlying processes and mechanisms using the new measurement
techniques.
3. Estimating spatiotemporal variability of measured carbon stocks and flows, particularly in response to disturbances such as climate change (Arias-Ortiz et al.
2018), human activities (e.g., Macreadie et al. 2015; Serrano et al. 2016; Atwood
et al. 2017; Kauffman et al. 2017; Lovelock et al. 2017), altered food web structure (Atwood et al. 2015), and non-steady-state conditions such as storm and
tsunami events (Cahoon et al. 2003).
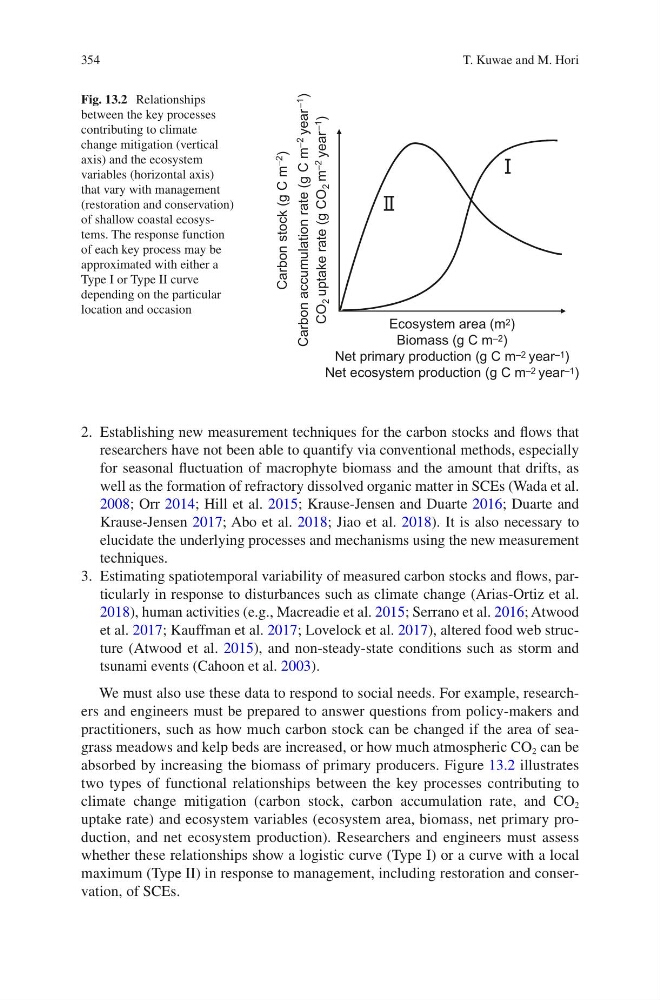
We must also use these data to respond to social needs. For example, researchers and engineers must be prepared to answer questions from policy-makers and
practitioners, such as how much carbon stock can be changed if the area of seagrass meadows and kelp beds are increased, or how much atmospheric CO 2 can be
absorbed by increasing the biomass of primary producers. Figure 13.2 illustrates
two types of functional relationships between the key processes contributing to
climate change mitigation (carbon stock, carbon accumulation rate, and CO 2
uptake rate) and ecosystem variables (ecosystem area, biomass, net primary production, and net ecosystem production). Researchers and engineers must assess
whether these relationships show a logistic curve (Type I) or a curve with a local
maximum (Type II) in response to management, including restoration and conservation, of SCEs.
Ecosystem area (m 2 )
Biomass (g C m –2 )
Net primary production (g C m –2 year –1 )
Net ecosystem production (g C m –2 year –1 )
Carbon stock (g C m –2
)
Carbon accumulation rate (g C m –2
year –1
)
CO
2 uptake rate (g CO
2 m –2
year –1
)
Fig. 13.2 Relationships
between the key processes
contributing to climate
change mitigation (vertical
axis) and the ecosystem
variables (horizontal axis)
that vary with management
(restoration and conservation)
of shallow coastal ecosystems. The response function
of each key process may be
approximated with either a
Type I or Type II curve
depending on the particular
location and occasion
T. Kuwae and M. Hori
2. Establishing new measurement techniques for the carbon stocks and flows that
researchers have not been able to quantify via conventional methods, especially
for seasonal fluctuation of macrophyte biomass and the amount that drifts, as
well as the formation of refractory dissolved organic matter in SCEs (Wada et al.
2008; Orr 2014; Hill et al. 2015; Krause-Jensen and Duarte 2016; Duarte and
Krause-Jensen 2017; Abo et al. 2018; Jiao et al. 2018). It is also necessary to
elucidate the underlying processes and mechanisms using the new measurement
techniques.
3. Estimating spatiotemporal variability of measured carbon stocks and flows, particularly in response to disturbances such as climate change (Arias-Ortiz et al.
2018), human activities (e.g., Macreadie et al. 2015; Serrano et al. 2016; Atwood
et al. 2017; Kauffman et al. 2017; Lovelock et al. 2017), altered food web structure (Atwood et al. 2015), and non-steady-state conditions such as storm and
tsunami events (Cahoon et al. 2003).
We must also use these data to respond to social needs. For example, researchers and engineers must be prepared to answer questions from policy-makers and
practitioners, such as how much carbon stock can be changed if the area of seagrass meadows and kelp beds are increased, or how much atmospheric CO 2 can be
absorbed by increasing the biomass of primary producers. Figure 13.2 illustrates
two types of functional relationships between the key processes contributing to
climate change mitigation (carbon stock, carbon accumulation rate, and CO 2
uptake rate) and ecosystem variables (ecosystem area, biomass, net primary production, and net ecosystem production). Researchers and engineers must assess
whether these relationships show a logistic curve (Type I) or a curve with a local
maximum (Type II) in response to management, including restoration and conservation, of SCEs.
Ecosystem area (m 2 )
Biomass (g C m –2 )
Net primary production (g C m –2 year –1 )
Net ecosystem production (g C m –2 year –1 )
Carbon stock (g C m –2
)
Carbon accumulation rate (g C m –2
year –1
)
CO
2 uptake rate (g CO
2 m –2
year –1
)
Fig. 13.2 Relationships
between the key processes
contributing to climate
change mitigation (vertical
axis) and the ecosystem
variables (horizontal axis)
that vary with management
(restoration and conservation)
of shallow coastal ecosystems. The response function
of each key process may be
approximated with either a
Type I or Type II curve
depending on the particular
location and occasion
T. Kuwae and M. Hori