

246
0.00
0.01
0.02
0.03
15
25
35
Sediment temperature (ºC)
GPP
(mg CO
2 /mg Chl-a/min)
(a)
0.0
1.0
2.0
3.0
4.0
15
25
35
Sediment temperature (ºC)
CO
2 emission
(mg CO
2 /m
2 /min)
(b)
R 2 = 0.99
R 2 = 0.67
y = 0.0007e 0.1053x
y = 0.0689e 0.1198x
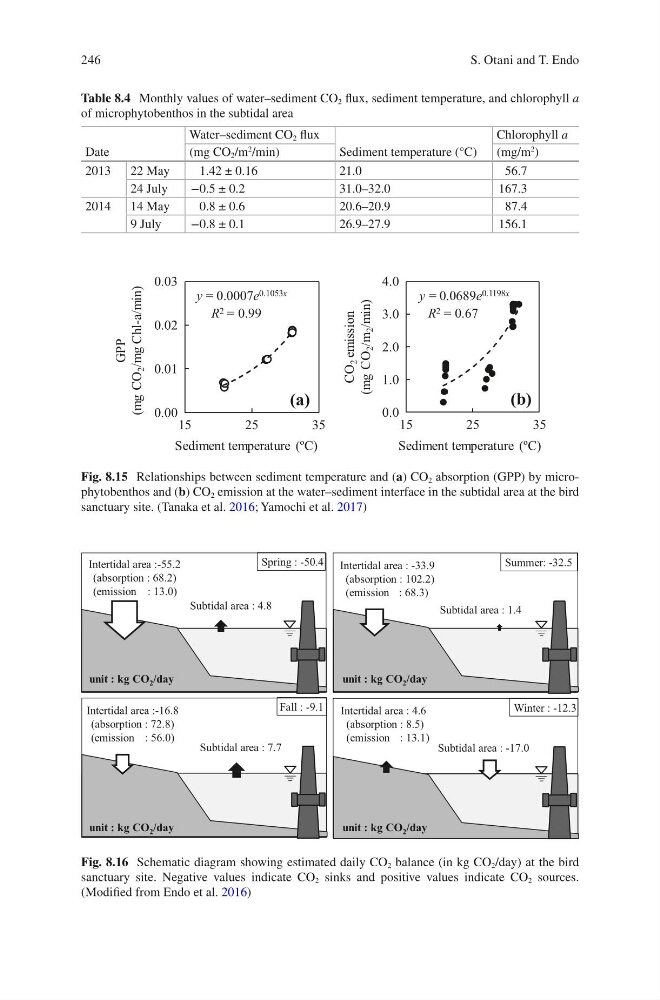
Fig. 8.15 Relationships between sediment temperature and (a) CO 2 absorption (GPP) by microphytobenthos and (b) CO 2 emission at the water–sediment interface in the subtidal area at the bird
sanctuary site. (Tanaka et al. 2016; Yamochi et al. 2017)
Spring : -50.4
unit : kg CO 2 /day
Intertidal area :-55.2
(absorption : 68.2)
(emission : 13.0)
Subtidal area : 4.8
Summer: -32.5
Fall : -9.1
Winter : -12.3
Intertidal area : -33.9
(absorption : 102.2)
(emission : 68.3)
Intertidal area :-16.8
(absorption : 72.8)
(emission : 56.0)
Intertidal area : 4.6
(absorption : 8.5)
(emission : 13.1)
Subtidal area : 1.4
Subtidal area : -17.0
Subtidal area : 7.7
unit : kg CO 2 /day
unit : kg CO 2 /day
unit : kg CO 2 /day
Fig. 8.16 Schematic diagram showing estimated daily CO 2 balance (in kg CO 2 /day) at the bird
sanctuary site. Negative values indicate CO 2 sinks and positive values indicate CO 2 sources.
(Modified from Endo et al. 2016)
Table 8.4 Monthly values of water–sediment CO 2 flux, sediment temperature, and chlorophyll a
of microphytobenthos in the subtidal area
Date
Water–sediment CO 2 flux
Sediment temperature (°C)
Chlorophyll a
(mg CO 2 /m
2 /min)
(mg/m
2 )
2013
22 May
1.42 ± 0.16
21.0
56.7
24 July
−0.5 ± 0.2
31.0–32.0
167.3
2014
14 May
0.8 ± 0.6
20.6–20.9
87.4
9 July
−0.8 ± 0.1
26.9–27.9
156.1
S. Otani and T. Endo
0.00
0.01
0.02
0.03
15
25
35
Sediment temperature (ºC)
GPP
(mg CO
2 /mg Chl-a/min)
(a)
0.0
1.0
2.0
3.0
4.0
15
25
35
Sediment temperature (ºC)
CO
2 emission
(mg CO
2 /m
2 /min)
(b)
R 2 = 0.99
R 2 = 0.67
y = 0.0007e 0.1053x
y = 0.0689e 0.1198x
Fig. 8.15 Relationships between sediment temperature and (a) CO 2 absorption (GPP) by microphytobenthos and (b) CO 2 emission at the water–sediment interface in the subtidal area at the bird
sanctuary site. (Tanaka et al. 2016; Yamochi et al. 2017)
Spring : -50.4
unit : kg CO 2 /day
Intertidal area :-55.2
(absorption : 68.2)
(emission : 13.0)
Subtidal area : 4.8
Summer: -32.5
Fall : -9.1
Winter : -12.3
Intertidal area : -33.9
(absorption : 102.2)
(emission : 68.3)
Intertidal area :-16.8
(absorption : 72.8)
(emission : 56.0)
Intertidal area : 4.6
(absorption : 8.5)
(emission : 13.1)
Subtidal area : 1.4
Subtidal area : -17.0
Subtidal area : 7.7
unit : kg CO 2 /day
unit : kg CO 2 /day
unit : kg CO 2 /day
Fig. 8.16 Schematic diagram showing estimated daily CO 2 balance (in kg CO 2 /day) at the bird
sanctuary site. Negative values indicate CO 2 sinks and positive values indicate CO 2 sources.
(Modified from Endo et al. 2016)
Table 8.4 Monthly values of water–sediment CO 2 flux, sediment temperature, and chlorophyll a
of microphytobenthos in the subtidal area
Date
Water–sediment CO 2 flux
Sediment temperature (°C)
Chlorophyll a
(mg CO 2 /m
2 /min)
(mg/m
2 )
2013
22 May
1.42 ± 0.16
21.0
56.7
24 July
−0.5 ± 0.2
31.0–32.0
167.3
2014
14 May
0.8 ± 0.6
20.6–20.9
87.4
9 July
−0.8 ± 0.1
26.9–27.9
156.1
S. Otani and T. Endo