

13
rates for seagrass beds. However, because seagrass beds have a more extensive distribution than mangrove forests, calculations of the rate of carbon storage for the
whole earth have made more use of the value for seagrass beds than of that for
mangrove forests. In the most recent calculations since the UNEP report, some revisions have been made to the value of each blue carbon ecosystem. The carbon storage rate of saltmarshes is the lowest, whereas the rates for mangrove forests and
seagrass beds are similar (Table 1.2, Bridgham 2014). However, saltmarshes, mangrove forests, and seagrass beds all have a higher carbon storage rate than other
coastal areas such as estuaries, continental shelves, and the deep sea. According to
the IPCC Fifth Report (2013), since the Industrial Revolution, the total amount of
black and brown carbon released by industrial activities has been about 555 billion
tons, of which 160 billion tons are sequestered and stored as green carbon and
155 billion tons are sequestered and stored as blue carbon. The remaining 240 billion tons are in the atmosphere. In recent years, it is estimated that the annual rates
of absorption by terrestrial vegetation and the ocean have been 2.3 billion tons C per
year and 2.4 billion tons C per year, respectively. Recent emissions from human
activities have averaged 9.4 billion tons C per year, and the residual amount in the
atmosphere has been 4.7 billion tons C per year (Chap. 11; Kuwae et al. 2018). The
total carbon sequestration rate on Earth has therefore been about 4.7 billion tons C
per year. The areal carbon storage rate of blue carbon ecosystems is estimated to be
20–30 times that of terrestrial vegetation such as tropical rainforests (Table 1.2).
Therefore, despite the fact that the total area of blue carbon ecosystems is less than
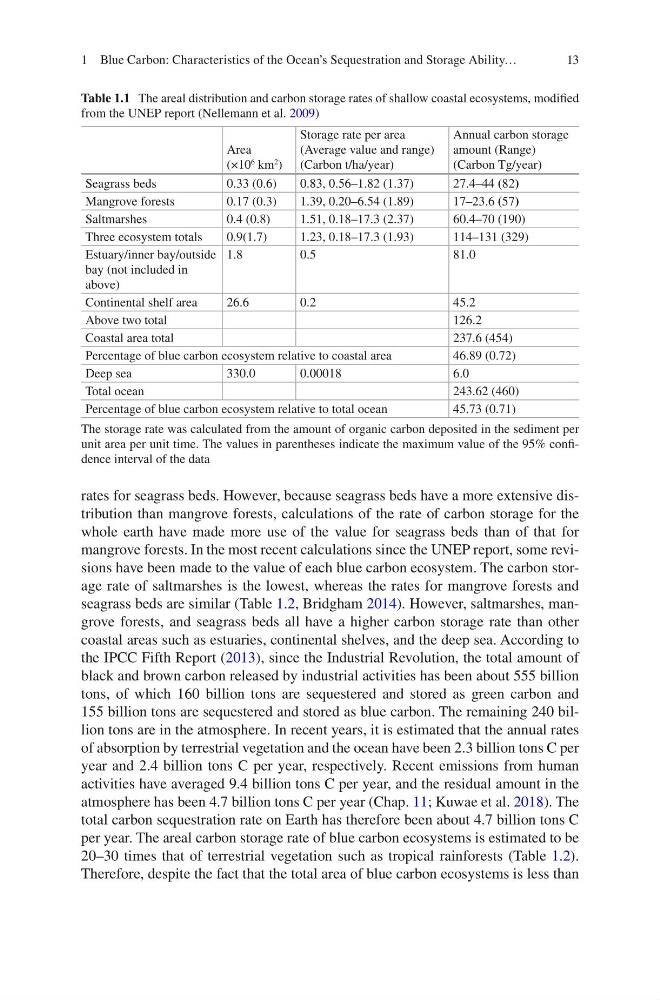
Table 1.1 The areal distribution and carbon storage rates of shallow coastal ecosystems, modified
from the UNEP report (Nellemann et al. 2009)
Area
(×10
6 km
2 )
Storage rate per area
(Average value and range)
(Carbon t/ha/year)
Annual carbon storage
amount (Range)
(Carbon Tg/year)
Seagrass beds
0.33 (0.6)
0.83, 0.56–1.82 (1.37)
27.4–44 (82)
Mangrove forests
0.17 (0.3)
1.39, 0.20–6.54 (1.89)
17–23.6 (57)
Saltmarshes
0.4 (0.8)
1.51, 0.18–17.3 (2.37)
60.4–70 (190)
Three ecosystem totals
0.9(1.7)
1.23, 0.18–17.3 (1.93)
114–131 (329)
Estuary/inner bay/outside
bay (not included in
above)
1.8
0.5
81.0
Continental shelf area
26.6
0.2
45.2
Above two total
126.2
Coastal area total
237.6 (454)
Percentage of blue carbon ecosystem relative to coastal area
46.89 (0.72)
Deep sea
330.0
0.00018
6.0
Total ocean
243.62 (460)
Percentage of blue carbon ecosystem relative to total ocean
45.73 (0.71)
The storage rate was calculated from the amount of organic carbon deposited in the sediment per
unit area per unit time. The values in parentheses indicate the maximum value of the 95% confidence interval of the data
1 Blue Carbon: Characteristics of the Ocean’s Sequestration and Storage Ability…
rates for seagrass beds. However, because seagrass beds have a more extensive distribution than mangrove forests, calculations of the rate of carbon storage for the
whole earth have made more use of the value for seagrass beds than of that for
mangrove forests. In the most recent calculations since the UNEP report, some revisions have been made to the value of each blue carbon ecosystem. The carbon storage rate of saltmarshes is the lowest, whereas the rates for mangrove forests and
seagrass beds are similar (Table 1.2, Bridgham 2014). However, saltmarshes, mangrove forests, and seagrass beds all have a higher carbon storage rate than other
coastal areas such as estuaries, continental shelves, and the deep sea. According to
the IPCC Fifth Report (2013), since the Industrial Revolution, the total amount of
black and brown carbon released by industrial activities has been about 555 billion
tons, of which 160 billion tons are sequestered and stored as green carbon and
155 billion tons are sequestered and stored as blue carbon. The remaining 240 billion tons are in the atmosphere. In recent years, it is estimated that the annual rates
of absorption by terrestrial vegetation and the ocean have been 2.3 billion tons C per
year and 2.4 billion tons C per year, respectively. Recent emissions from human
activities have averaged 9.4 billion tons C per year, and the residual amount in the
atmosphere has been 4.7 billion tons C per year (Chap. 11; Kuwae et al. 2018). The
total carbon sequestration rate on Earth has therefore been about 4.7 billion tons C
per year. The areal carbon storage rate of blue carbon ecosystems is estimated to be
20–30 times that of terrestrial vegetation such as tropical rainforests (Table 1.2).
Therefore, despite the fact that the total area of blue carbon ecosystems is less than
Table 1.1 The areal distribution and carbon storage rates of shallow coastal ecosystems, modified
from the UNEP report (Nellemann et al. 2009)
Area
(×10
6 km
2 )
Storage rate per area
(Average value and range)
(Carbon t/ha/year)
Annual carbon storage
amount (Range)
(Carbon Tg/year)
Seagrass beds
0.33 (0.6)
0.83, 0.56–1.82 (1.37)
27.4–44 (82)
Mangrove forests
0.17 (0.3)
1.39, 0.20–6.54 (1.89)
17–23.6 (57)
Saltmarshes
0.4 (0.8)
1.51, 0.18–17.3 (2.37)
60.4–70 (190)
Three ecosystem totals
0.9(1.7)
1.23, 0.18–17.3 (1.93)
114–131 (329)
Estuary/inner bay/outside
bay (not included in
above)
1.8
0.5
81.0
Continental shelf area
26.6
0.2
45.2
Above two total
126.2
Coastal area total
237.6 (454)
Percentage of blue carbon ecosystem relative to coastal area
46.89 (0.72)
Deep sea
330.0
0.00018
6.0
Total ocean
243.62 (460)
Percentage of blue carbon ecosystem relative to total ocean
45.73 (0.71)
The storage rate was calculated from the amount of organic carbon deposited in the sediment per
unit area per unit time. The values in parentheses indicate the maximum value of the 95% confidence interval of the data
1 Blue Carbon: Characteristics of the Ocean’s Sequestration and Storage Ability…