

231
flux was calculated from the changes in CO 2 concentration inside the chamber. The
photon density flux was measured by using a pocket-sized PAR logger (JFE advantec Co.: DEFI2-L), and the atmospheric CO 2 concentration and temperature were
measured by using a CO 2 data logger (T&D Co.: Tr-76Ui). The sediment temperature in air was measured by using a temperature data logger (Onset Computer Co.:
Tidbit v2), and the chlorophyll a (Chl-a) concentration of sediment was measured
by the acetone extraction analysis method. In the water column, we measured water
temperature, salinity, fluorescence intensity of phytoplankton Chl-a (JFE advantec
Co.: Compact CTD), pH (TOA DKK Co.:MM-43X), and dissolved oxygen (Hack
Co.: HQ40d) and dissolved inorganic carbon concentrations.
In the subtidal area, we measured the water–sediment CO 2 flux during daytime
on 22 May and 9 July 2013 and 14 May and 24 July 2014. A light chamber and a
dark chamber (volume 1.51 × 10
−2
m
3
, bottom area 7.21 × 10
−2
m
2
) were placed on
the sea bottom, and the time series of CO 2 partial pressure (pCO 2 ) inside the
chambers was measured by using a gas-liquid equilibrium sensor made of PTFE
tubing (Sumitomo Electric Fine Polymer, Inc.; inner diameter 4.0 mm, porosity
60%) in which pCO 2 inside the tube was pumped and measured by a flow-through
type CO 2 gas analyzer (Vaisala Co.: GMP-343).
8.3.2 Measurement Methods
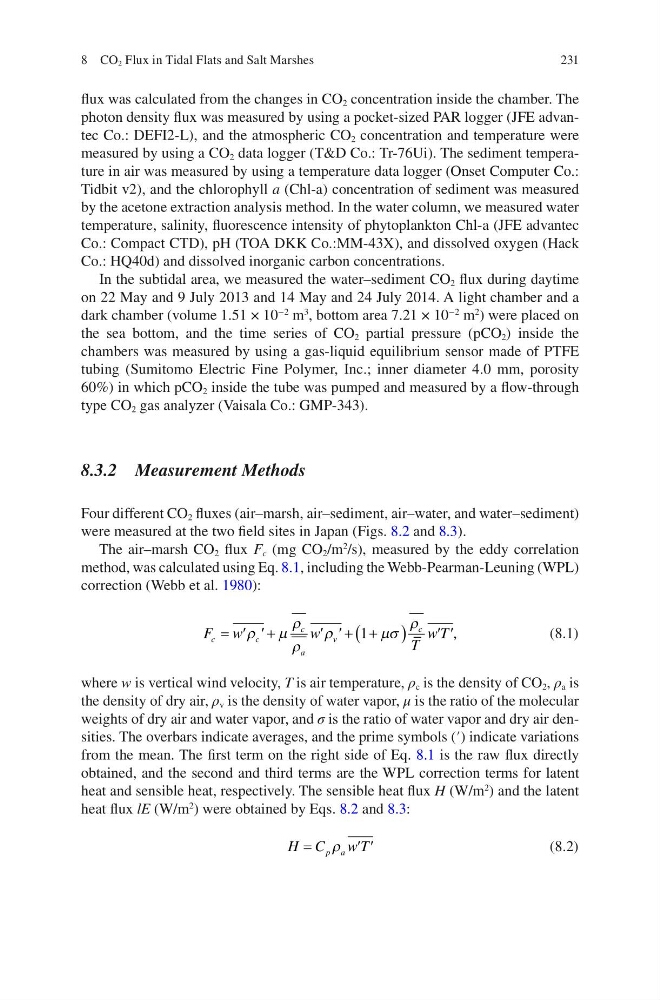
Four different CO 2 fluxes (air–marsh, air–sediment, air–water, and water–sediment)
were measured at the two field sites in Japan (Figs. 8.2 and 8.3).
The air–marsh CO 2 flux F c (mg CO 2 /m
2
/s), measured by the eddy correlation
method, was calculated using Eq. 8.1, including the Webb-Pearman-Leuning (WPL)
correction (Webb et al. 1980):
F w
w
T
w T
c
c
c
a
v
c
= ¢ ¢ +
¢ ¢+ +
(
)
¢ ¢
r
m
r
r
r
m s
r
1
,
(8.1)
where w is vertical wind velocity, T is air temperature, ρ c is the density of CO 2 , ρ a is
the density of dry air, ρ v is the density of water vapor, μ is the ratio of the molecular
weights of dry air and water vapor, and σ is the ratio of water vapor and dry air densities. The overbars indicate averages, and the prime symbols (′) indicate variations
from the mean. The first term on the right side of Eq. 8.1 is the raw flux directly
obtained, and the second and third terms are the WPL correction terms for latent
heat and sensible heat, respectively. The sensible heat flux H (W/m
2
) and the latent
heat flux lE (W/m
2
) were obtained by Eqs. 8.2 and 8.3:
H C
w T
p a
=
¢ ¢
r
(8.2)
8 CO 2 Flux in Tidal Flats and Salt Marshes
flux was calculated from the changes in CO 2 concentration inside the chamber. The
photon density flux was measured by using a pocket-sized PAR logger (JFE advantec Co.: DEFI2-L), and the atmospheric CO 2 concentration and temperature were
measured by using a CO 2 data logger (T&D Co.: Tr-76Ui). The sediment temperature in air was measured by using a temperature data logger (Onset Computer Co.:
Tidbit v2), and the chlorophyll a (Chl-a) concentration of sediment was measured
by the acetone extraction analysis method. In the water column, we measured water
temperature, salinity, fluorescence intensity of phytoplankton Chl-a (JFE advantec
Co.: Compact CTD), pH (TOA DKK Co.:MM-43X), and dissolved oxygen (Hack
Co.: HQ40d) and dissolved inorganic carbon concentrations.
In the subtidal area, we measured the water–sediment CO 2 flux during daytime
on 22 May and 9 July 2013 and 14 May and 24 July 2014. A light chamber and a
dark chamber (volume 1.51 × 10
−2
m
3
, bottom area 7.21 × 10
−2
m
2
) were placed on
the sea bottom, and the time series of CO 2 partial pressure (pCO 2 ) inside the
chambers was measured by using a gas-liquid equilibrium sensor made of PTFE
tubing (Sumitomo Electric Fine Polymer, Inc.; inner diameter 4.0 mm, porosity
60%) in which pCO 2 inside the tube was pumped and measured by a flow-through
type CO 2 gas analyzer (Vaisala Co.: GMP-343).
8.3.2 Measurement Methods
Four different CO 2 fluxes (air–marsh, air–sediment, air–water, and water–sediment)
were measured at the two field sites in Japan (Figs. 8.2 and 8.3).
The air–marsh CO 2 flux F c (mg CO 2 /m
2
/s), measured by the eddy correlation
method, was calculated using Eq. 8.1, including the Webb-Pearman-Leuning (WPL)
correction (Webb et al. 1980):
F w
w
T
w T
c
c
c
a
v
c
= ¢ ¢ +
¢ ¢+ +
(
)
¢ ¢
r
m
r
r
r
m s
r
1
,
(8.1)
where w is vertical wind velocity, T is air temperature, ρ c is the density of CO 2 , ρ a is
the density of dry air, ρ v is the density of water vapor, μ is the ratio of the molecular
weights of dry air and water vapor, and σ is the ratio of water vapor and dry air densities. The overbars indicate averages, and the prime symbols (′) indicate variations
from the mean. The first term on the right side of Eq. 8.1 is the raw flux directly
obtained, and the second and third terms are the WPL correction terms for latent
heat and sensible heat, respectively. The sensible heat flux H (W/m
2
) and the latent
heat flux lE (W/m
2
) were obtained by Eqs. 8.2 and 8.3:
H C
w T
p a
=
¢ ¢
r
(8.2)
8 CO 2 Flux in Tidal Flats and Salt Marshes