

228
reed Phragmites australis; for example, the CO 2 flux between the air and the salt
marsh ecosystem (air–salt marsh CO 2 flux hereafter) was found to be −1037 mmol
C/m
2
/day in the Yangtze River estuary (Guo et al. 2009). Also, the CO 2 flux between
the air and the tidal flat ecosystem (air–tidal flat CO 2 flux hereafter) was measured
in a tidal flat area in Japan where an observation tower was constructed (Tanaka and
Takikawa 2006), and CO 2 was found to be absorbed largely during daytime emersion periods, which suggested a significant contribution by microphytobenthos.
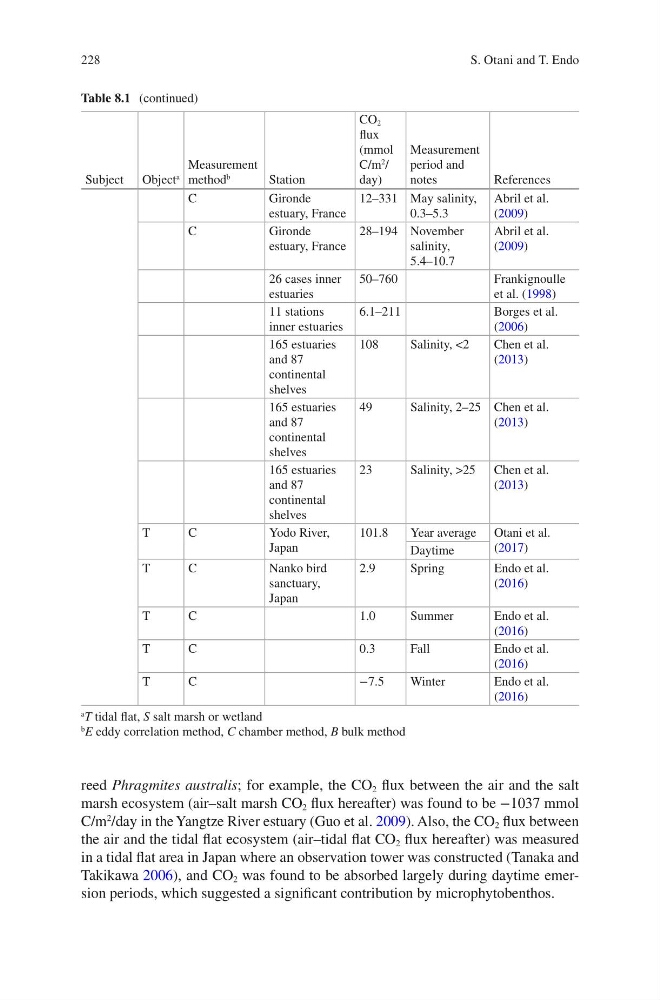
Table 8.1 (continued)
Subject Object
a
Measurement
method
b
Station
CO 2
flux
(mmol
C/m
2 /
day)
Measurement
period and
notes
References
C
Gironde
estuary, France
12–331 May salinity,
0.3–5.3
Abril et al.
(2009)
C
Gironde
estuary, France
28–194 November
salinity,
5.4–10.7
Abril et al.
(2009)
26 cases inner
estuaries
50–760
Frankignoulle
et al. (1998)
11 stations
inner estuaries
6.1–211
Borges et al.
(2006)
165 estuaries
and 87
continental
shelves
108
Salinity, <2
Chen et al.
(2013)
165 estuaries
and 87
continental
shelves
49
Salinity, 2–25 Chen et al.
(2013)
165 estuaries
and 87
continental
shelves
23
Salinity, >25 Chen et al.
(2013)
T
C
Yodo River,
Japan
101.8
Year average Otani et al.
(2017)
Daytime
T
C
Nanko bird
sanctuary,
Japan
2.9
Spring
Endo et al.
(2016)
T
C
1.0
Summer
Endo et al.
(2016)
T
C
0.3
Fall
Endo et al.
(2016)
T
C
−7.5
Winter
Endo et al.
(2016)
a
T tidal flat, S salt marsh or wetland
b
E eddy correlation method, C chamber method, B bulk method
S. Otani and T. Endo
reed Phragmites australis; for example, the CO 2 flux between the air and the salt
marsh ecosystem (air–salt marsh CO 2 flux hereafter) was found to be −1037 mmol
C/m
2
/day in the Yangtze River estuary (Guo et al. 2009). Also, the CO 2 flux between
the air and the tidal flat ecosystem (air–tidal flat CO 2 flux hereafter) was measured
in a tidal flat area in Japan where an observation tower was constructed (Tanaka and
Takikawa 2006), and CO 2 was found to be absorbed largely during daytime emersion periods, which suggested a significant contribution by microphytobenthos.
Table 8.1 (continued)
Subject Object
a
Measurement
method
b
Station
CO 2
flux
(mmol
C/m
2 /
day)
Measurement
period and
notes
References
C
Gironde
estuary, France
12–331 May salinity,
0.3–5.3
Abril et al.
(2009)
C
Gironde
estuary, France
28–194 November
salinity,
5.4–10.7
Abril et al.
(2009)
26 cases inner
estuaries
50–760
Frankignoulle
et al. (1998)
11 stations
inner estuaries
6.1–211
Borges et al.
(2006)
165 estuaries
and 87
continental
shelves
108
Salinity, <2
Chen et al.
(2013)
165 estuaries
and 87
continental
shelves
49
Salinity, 2–25 Chen et al.
(2013)
165 estuaries
and 87
continental
shelves
23
Salinity, >25 Chen et al.
(2013)
T
C
Yodo River,
Japan
101.8
Year average Otani et al.
(2017)
Daytime
T
C
Nanko bird
sanctuary,
Japan
2.9
Spring
Endo et al.
(2016)
T
C
1.0
Summer
Endo et al.
(2016)
T
C
0.3
Fall
Endo et al.
(2016)
T
C
−7.5
Winter
Endo et al.
(2016)
a
T tidal flat, S salt marsh or wetland
b
E eddy correlation method, C chamber method, B bulk method
S. Otani and T. Endo