

93
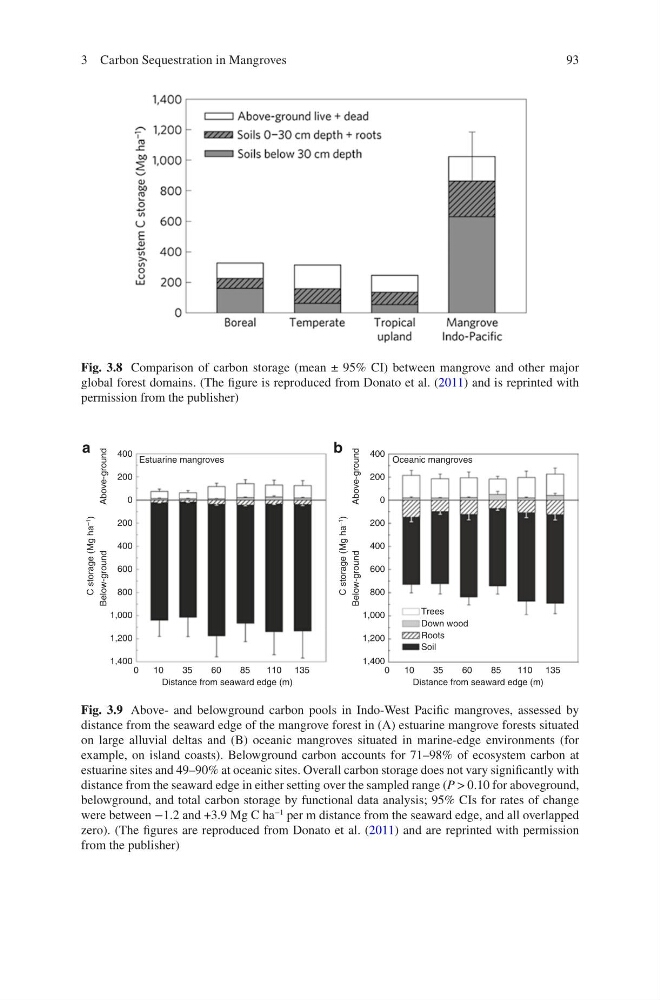
Fig. 3.8 Comparison of carbon storage (mean ± 95% CI) between mangrove and other major
global forest domains. (The figure is reproduced from Donato et al. (2011) and is reprinted with
permission from the publisher)
400
200
0
200
400
600
800
1,000
1,200
1,400
0
10
3 5
6 0
8 5
Distance from seaward edge (m)
Estuarine mangroves
Above-ground
Below-ground
C storage (Mg ha
–1
)
110 135
400
a
b
200
0
200
Trees
Down wood
Roots
Soil
400
600
800
1,000
1,200
1,400
0
10
3 5
6 0
8 5
Distance from seaward edge (m)
Oceanic mangroves
Above-ground
Below-ground
C storage (Mg ha
–1
)
110 135
Fig. 3.9 Above- and belowground carbon pools in Indo-West Pacific mangroves, assessed by
distance from the seaward edge of the mangrove forest in (A) estuarine mangrove forests situated
on large alluvial deltas and (B) oceanic mangroves situated in marine-edge environments (for
example, on island coasts). Belowground carbon accounts for 71–98% of ecosystem carbon at
estuarine sites and 49–90% at oceanic sites. Overall carbon storage does not vary significantly with
distance from the seaward edge in either setting over the sampled range (P > 0.10 for aboveground,
belowground, and total carbon storage by functional data analysis; 95% CIs for rates of change
were between −1.2 and +3.9 Mg C ha
−1 per m distance from the seaward edge, and all overlapped
zero). (The figures are reproduced from Donato et al. (2011) and are reprinted with permission
from the publisher)
3 Carbon Sequestration in Mangroves
Fig. 3.8 Comparison of carbon storage (mean ± 95% CI) between mangrove and other major
global forest domains. (The figure is reproduced from Donato et al. (2011) and is reprinted with
permission from the publisher)
400
200
0
200
400
600
800
1,000
1,200
1,400
0
10
3 5
6 0
8 5
Distance from seaward edge (m)
Estuarine mangroves
Above-ground
Below-ground
C storage (Mg ha
–1
)
110 135
400
a
b
200
0
200
Trees
Down wood
Roots
Soil
400
600
800
1,000
1,200
1,400
0
10
3 5
6 0
8 5
Distance from seaward edge (m)
Oceanic mangroves
Above-ground
Below-ground
C storage (Mg ha
–1
)
110 135
Fig. 3.9 Above- and belowground carbon pools in Indo-West Pacific mangroves, assessed by
distance from the seaward edge of the mangrove forest in (A) estuarine mangrove forests situated
on large alluvial deltas and (B) oceanic mangroves situated in marine-edge environments (for
example, on island coasts). Belowground carbon accounts for 71–98% of ecosystem carbon at
estuarine sites and 49–90% at oceanic sites. Overall carbon storage does not vary significantly with
distance from the seaward edge in either setting over the sampled range (P > 0.10 for aboveground,
belowground, and total carbon storage by functional data analysis; 95% CIs for rates of change
were between −1.2 and +3.9 Mg C ha
−1 per m distance from the seaward edge, and all overlapped
zero). (The figures are reproduced from Donato et al. (2011) and are reprinted with permission
from the publisher)
3 Carbon Sequestration in Mangroves