

91
biological activities. If oxygen is available, it can act as an electron acceptor and the
decomposition products are CO 2 and H 2 O. In wetland soils where oxygen is scarce,
other electron acceptors such as nitrates, manganese and iron oxides, sulfates, and
the organic matter itself are used, and compounds such as CH 4 and HCO 3
−
are
produced.
All processes that affect necromass increments and decrements are reflected in
the ecosystem organic carbon burial rate (g C m
−2
year
−1
). Organic carbon burial
rates in an ecosystem are generally obtained by measuring the concentration of
organic carbon in the soil and estimating the time interval during which the carbon
in all or part of the soil profile accumulated. The rate is then calculated by dividing
the measured amount of organic carbon by the estimated time interval. Time intervals at the millennial scale can be determined by
14
C dating; those at the centennial
scale by
210
Pb and
137
Cs dating; and those at the sub-annual scale by using markers
for past surface elevations (e.g., Cahoon and Lynch 1997). A number of studies have
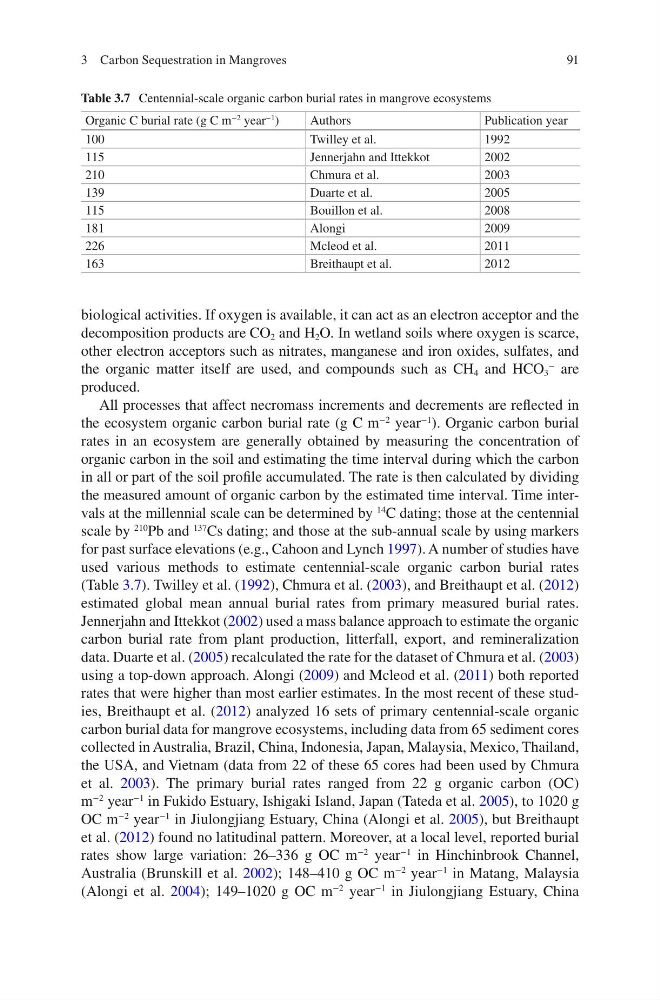
used various methods to estimate centennial-scale organic carbon burial rates
(Table 3.7). Twilley et al. (1992), Chmura et al. (2003), and Breithaupt et al. (2012)
estimated global mean annual burial rates from primary measured burial rates.
Jennerjahn and Ittekkot (2002) used a mass balance approach to estimate the organic
carbon burial rate from plant production, litterfall, export, and remineralization
data. Duarte et al. (2005) recalculated the rate for the dataset of Chmura et al. (2003)
using a top-down approach. Alongi (2009) and Mcleod et al. (2011) both reported
rates that were higher than most earlier estimates. In the most recent of these studies, Breithaupt et al. (2012) analyzed 16 sets of primary centennial-scale organic
carbon burial data for mangrove ecosystems, including data from 65 sediment cores
collected in Australia, Brazil, China, Indonesia, Japan, Malaysia, Mexico, Thailand,
the USA, and Vietnam (data from 22 of these 65 cores had been used by Chmura
et al. 2003). The primary burial rates ranged from 22 g organic carbon (OC)
m
−2
year
−1
in Fukido Estuary, Ishigaki Island, Japan (Tateda et al. 2005), to 1020 g
OC m
−2
year
−1
in Jiulongjiang Estuary, China (Alongi et al. 2005), but Breithaupt
et al. (2012) found no latitudinal pattern. Moreover, at a local level, reported burial
rates show large variation: 26–336 g OC m
−2
year
−1
in Hinchinbrook Channel,
Australia (Brunskill et al. 2002); 148–410 g OC m
−2
year
−1
in Matang, Malaysia
(Alongi et al. 2004); 149–1020 g OC m
−2
year
−1
in Jiulongjiang Estuary, China
Table 3.7 Centennial-scale organic carbon burial rates in mangrove ecosystems
Organic C burial rate (g C m
−2 year
−1 )
Authors
Publication year
100
Twilley et al.
1992
115
Jennerjahn and Ittekkot
2002
210
Chmura et al.
2003
139
Duarte et al.
2005
115
Bouillon et al.
2008
181
Alongi
2009
226
Mcleod et al.
2011
163
Breithaupt et al.
2012
3 Carbon Sequestration in Mangroves
biological activities. If oxygen is available, it can act as an electron acceptor and the
decomposition products are CO 2 and H 2 O. In wetland soils where oxygen is scarce,
other electron acceptors such as nitrates, manganese and iron oxides, sulfates, and
the organic matter itself are used, and compounds such as CH 4 and HCO 3
−
are
produced.
All processes that affect necromass increments and decrements are reflected in
the ecosystem organic carbon burial rate (g C m
−2
year
−1
). Organic carbon burial
rates in an ecosystem are generally obtained by measuring the concentration of
organic carbon in the soil and estimating the time interval during which the carbon
in all or part of the soil profile accumulated. The rate is then calculated by dividing
the measured amount of organic carbon by the estimated time interval. Time intervals at the millennial scale can be determined by
14
C dating; those at the centennial
scale by
210
Pb and
137
Cs dating; and those at the sub-annual scale by using markers
for past surface elevations (e.g., Cahoon and Lynch 1997). A number of studies have
used various methods to estimate centennial-scale organic carbon burial rates
(Table 3.7). Twilley et al. (1992), Chmura et al. (2003), and Breithaupt et al. (2012)
estimated global mean annual burial rates from primary measured burial rates.
Jennerjahn and Ittekkot (2002) used a mass balance approach to estimate the organic
carbon burial rate from plant production, litterfall, export, and remineralization
data. Duarte et al. (2005) recalculated the rate for the dataset of Chmura et al. (2003)
using a top-down approach. Alongi (2009) and Mcleod et al. (2011) both reported
rates that were higher than most earlier estimates. In the most recent of these studies, Breithaupt et al. (2012) analyzed 16 sets of primary centennial-scale organic
carbon burial data for mangrove ecosystems, including data from 65 sediment cores
collected in Australia, Brazil, China, Indonesia, Japan, Malaysia, Mexico, Thailand,
the USA, and Vietnam (data from 22 of these 65 cores had been used by Chmura
et al. 2003). The primary burial rates ranged from 22 g organic carbon (OC)
m
−2
year
−1
in Fukido Estuary, Ishigaki Island, Japan (Tateda et al. 2005), to 1020 g
OC m
−2
year
−1
in Jiulongjiang Estuary, China (Alongi et al. 2005), but Breithaupt
et al. (2012) found no latitudinal pattern. Moreover, at a local level, reported burial
rates show large variation: 26–336 g OC m
−2
year
−1
in Hinchinbrook Channel,
Australia (Brunskill et al. 2002); 148–410 g OC m
−2
year
−1
in Matang, Malaysia
(Alongi et al. 2004); 149–1020 g OC m
−2
year
−1
in Jiulongjiang Estuary, China
Table 3.7 Centennial-scale organic carbon burial rates in mangrove ecosystems
Organic C burial rate (g C m
−2 year
−1 )
Authors
Publication year
100
Twilley et al.
1992
115
Jennerjahn and Ittekkot
2002
210
Chmura et al.
2003
139
Duarte et al.
2005
115
Bouillon et al.
2008
181
Alongi
2009
226
Mcleod et al.
2011
163
Breithaupt et al.
2012
3 Carbon Sequestration in Mangroves