

10. Plant Diversity in a Patchy Landscape
151
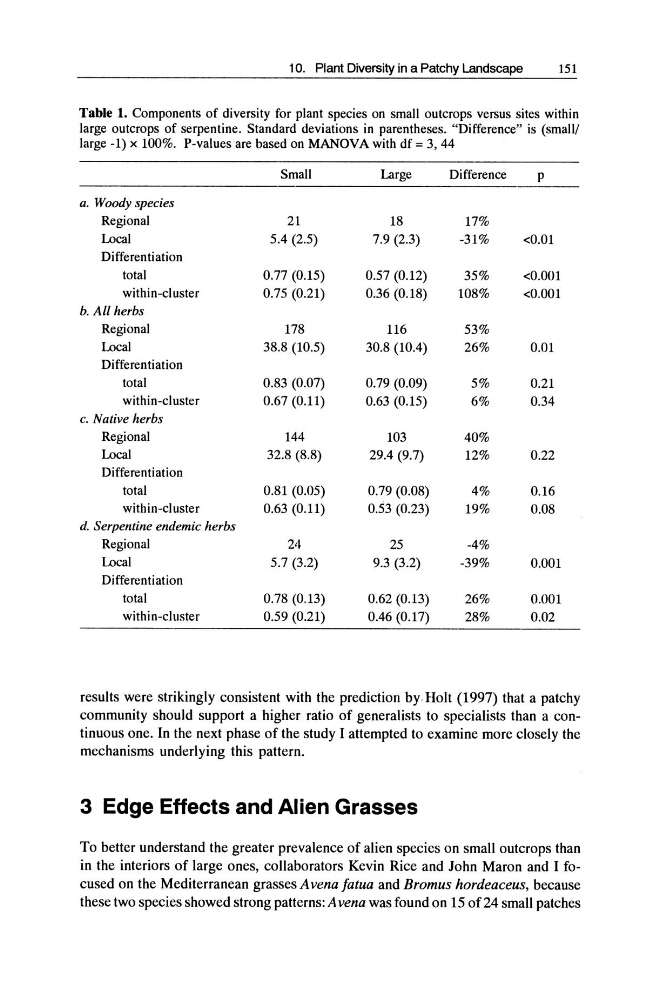
Table 1. Components of diversity for plant species on small outcrops versus sites within
large outcrops of serpentine. Standard deviations in parentheses. "Difference" is (small/
large -1) x 100%. P-values are based on MANOVA with df = 3, 44
Small
Large
Difference
p
a. Woody species
Regional
21
18
17%
Local
504 (2.5)
7.9 (2.3)
-31%
<0.01
Differentiation
total
0.77 (0.15)
0.57 (0.12)
35%
<0.001
within-c1 uster
0.75 (0.21)
0.36 (0.18)
108%
<0.001
b. All herbs
Regional
178
116
53%
Local
38.8 (10.5)
30.8 (lOA)
26%
0.01
Differentiation
total
0.83 (0.07)
0.79 (0.09)
5%
0.21
within-cluster
0.67 (0.11)
0.63 (0.15)
6%
0.34
c. Native herbs
Regional
144
103
40%
Local
32.8 (8.8)
2904 (9.7)
12%
0.22
Differentiation
total
0.81 (0.05)
0.79 (0.08)
4%
0.16
within-cluster
0.63 (0.11)
0.53 (0.23)
19%
0.08
d. Serpentine endemic herbs
Regional
24
25
-4%
Local
5.7 (3.2)
9.3 (3.2)
-39%
0.001
Differentiation
total
0.78 (0.13)
0.62 (0.13)
26%
0.001
within-cluster
0.59 (0.21)
0.46 (0.17)
28%
0.02
results were strikingly consistent with the prediction by Holt (1997) that a patchy
community should support a higher ratio of generalists to specialists than a continuous one. In the next phase of the study I attempted to examine more closely the
mechanisms underlying this pattern.
3 Edge Effects and Alien Grasses
To better understand the greater prevalence of alien species on small outcrops than
in the interiors of large ones, collaborators Kevin Rice and John Maron and I focused on the Mediterranean grasses A vena fatua and Bromus hordeaceus, because
these two species showed strong patterns: A vena was found on 15 of 24 small patches
151
Table 1. Components of diversity for plant species on small outcrops versus sites within
large outcrops of serpentine. Standard deviations in parentheses. "Difference" is (small/
large -1) x 100%. P-values are based on MANOVA with df = 3, 44
Small
Large
Difference
p
a. Woody species
Regional
21
18
17%
Local
504 (2.5)
7.9 (2.3)
-31%
<0.01
Differentiation
total
0.77 (0.15)
0.57 (0.12)
35%
<0.001
within-c1 uster
0.75 (0.21)
0.36 (0.18)
108%
<0.001
b. All herbs
Regional
178
116
53%
Local
38.8 (10.5)
30.8 (lOA)
26%
0.01
Differentiation
total
0.83 (0.07)
0.79 (0.09)
5%
0.21
within-cluster
0.67 (0.11)
0.63 (0.15)
6%
0.34
c. Native herbs
Regional
144
103
40%
Local
32.8 (8.8)
2904 (9.7)
12%
0.22
Differentiation
total
0.81 (0.05)
0.79 (0.08)
4%
0.16
within-cluster
0.63 (0.11)
0.53 (0.23)
19%
0.08
d. Serpentine endemic herbs
Regional
24
25
-4%
Local
5.7 (3.2)
9.3 (3.2)
-39%
0.001
Differentiation
total
0.78 (0.13)
0.62 (0.13)
26%
0.001
within-cluster
0.59 (0.21)
0.46 (0.17)
28%
0.02
results were strikingly consistent with the prediction by Holt (1997) that a patchy
community should support a higher ratio of generalists to specialists than a continuous one. In the next phase of the study I attempted to examine more closely the
mechanisms underlying this pattern.
3 Edge Effects and Alien Grasses
To better understand the greater prevalence of alien species on small outcrops than
in the interiors of large ones, collaborators Kevin Rice and John Maron and I focused on the Mediterranean grasses A vena fatua and Bromus hordeaceus, because
these two species showed strong patterns: A vena was found on 15 of 24 small patches