

126
J.H. Lawton
160
p
140
~120
'>
:;:
g 100
'0
e 80
Q.
~ 60
ns
E
.;:
Q.
2
4
8
16
Species richness
32
64
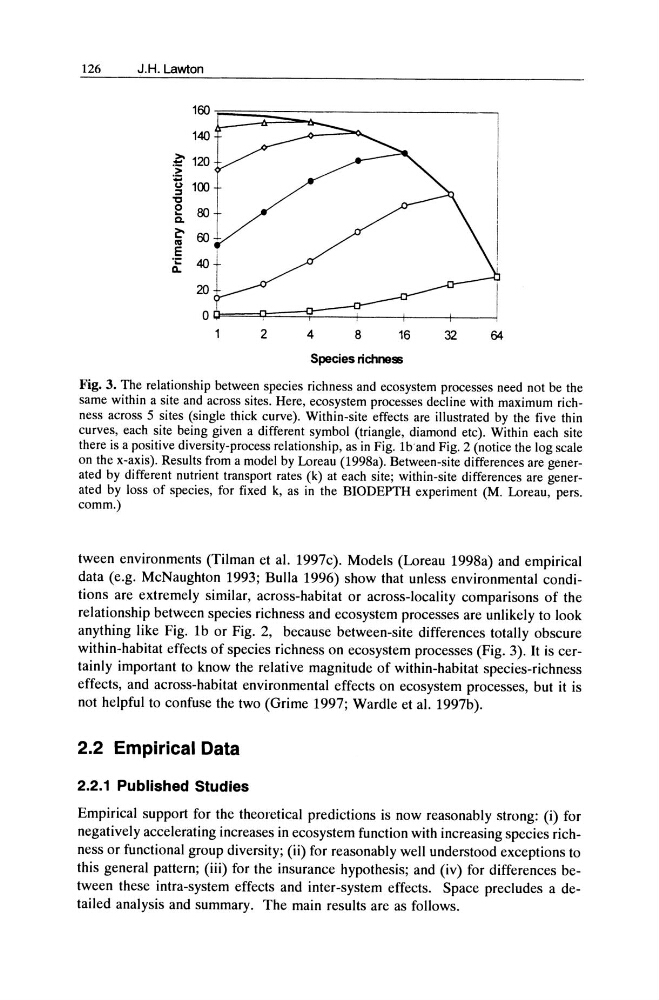
Fig. 3. The relationship between species richness and ecosystem processes need not be the
same within a site and across sites. Here, ecosystem processes decline with maximum richness across 5 sites (single thick curve). Within-site effects are illustrated by the five thin
curves, each site being given a different symbol (triangle, diamond etc). Within each site
there is a positive diversity-process relationship, as in Fig. Iband Fig. 2 (notice the log scale
on the x-axis). Results from a model by Loreau (1998a). Between-site differences are generated by different nutrient transport rates (k) at each site; within-site differences are generated by loss of species, for fixed k, as in the BIODEPTH experiment (M. Loreau, pers.
comm.)
tween environments (Tilman et al. 1997c). Models (Loreau 1998a) and empirical
data (e.g. McNaughton 1993; Bulla 1996) show that unless environmental conditions are extremely similar, across-habitat or across-locality comparisons of the
relationship between species richness and ecosystem processes are unlikely to look
anything like Fig. 1b or Fig. 2, because between-site differences totally obscure
within-habitat effects of species richness on ecosystem processes (Fig. 3). It is certainly important to know the relative magnitude of within-habitat species-richness
effects, and across-habitat environmental effects on ecosystem processes, but it is
not helpful to confuse the two (Grime 1997; Wardle et al. 1997b).
2.2 Empirical Data
2.2.1 Published Studies
Empirical support for the theOl'ctical predictions is now reasonably strong: (i) for
negatively accelerating increases in ecosystem function with increasing species richness or functional group diversity; (ii) for reasonably well understood exceptions to
this general pattern; (iii) for the insurance hypothesis; and (iv) for differences between these intra-system effects and inter-system effects. Space precludes a detailed analysis and summary. The main results are as follows.
J.H. Lawton
160
p
140
~120
'>
:;:
g 100
'0
e 80
Q.
~ 60
ns
E
.;:
Q.
2
4
8
16
Species richness
32
64
Fig. 3. The relationship between species richness and ecosystem processes need not be the
same within a site and across sites. Here, ecosystem processes decline with maximum richness across 5 sites (single thick curve). Within-site effects are illustrated by the five thin
curves, each site being given a different symbol (triangle, diamond etc). Within each site
there is a positive diversity-process relationship, as in Fig. Iband Fig. 2 (notice the log scale
on the x-axis). Results from a model by Loreau (1998a). Between-site differences are generated by different nutrient transport rates (k) at each site; within-site differences are generated by loss of species, for fixed k, as in the BIODEPTH experiment (M. Loreau, pers.
comm.)
tween environments (Tilman et al. 1997c). Models (Loreau 1998a) and empirical
data (e.g. McNaughton 1993; Bulla 1996) show that unless environmental conditions are extremely similar, across-habitat or across-locality comparisons of the
relationship between species richness and ecosystem processes are unlikely to look
anything like Fig. 1b or Fig. 2, because between-site differences totally obscure
within-habitat effects of species richness on ecosystem processes (Fig. 3). It is certainly important to know the relative magnitude of within-habitat species-richness
effects, and across-habitat environmental effects on ecosystem processes, but it is
not helpful to confuse the two (Grime 1997; Wardle et al. 1997b).
2.2 Empirical Data
2.2.1 Published Studies
Empirical support for the theOl'ctical predictions is now reasonably strong: (i) for
negatively accelerating increases in ecosystem function with increasing species richness or functional group diversity; (ii) for reasonably well understood exceptions to
this general pattern; (iii) for the insurance hypothesis; and (iv) for differences between these intra-system effects and inter-system effects. Space precludes a detailed analysis and summary. The main results are as follows.