

4. Methods of Estimating Belowground Net Primary Production
67
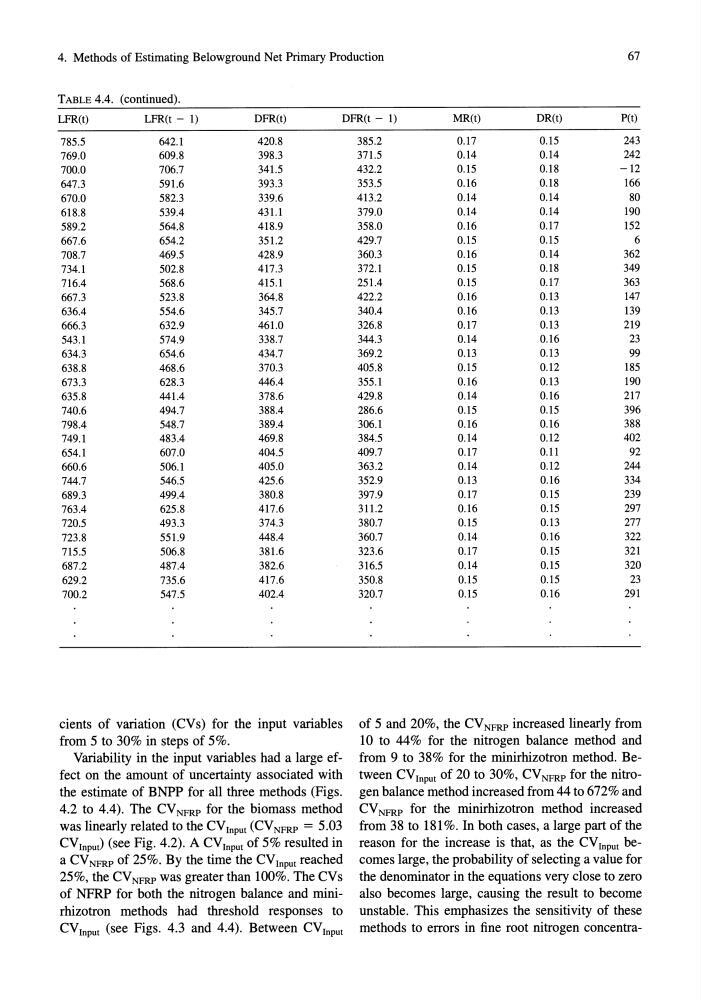
TABLE 4.4. (continued).
LFR(t)
LFR(t - 1)
DFR(t)
785.5
642.1
420.8
769.0
609.8
398.3
700.0
706.7
341.5
647.3
591.6
393.3
670.0
582.3
339.6
618.8
539.4
431.1
589.2
564.8
418.9
667.6
654.2
351.2
708.7
469.5
428.9
734.1
502.8
417.3
716.4
568.6
415.1
667.3
523.8
364.8
636.4
554.6
345.7
666.3
632.9
461.0
543.1
574.9
338.7
634.3
654.6
434.7
638.8
468.6
370.3
673.3
628.3
446.4
635.8
441.4
378.6
740.6
494.7
388.4
798.4
548.7
389.4
749.1
483.4
469.8
654.1
607.0
404.5
660.6
506.1
405.0
744.7
546.5
425.6
689.3
499.4
380.8
763.4
625.8
417.6
720.5
493.3
374.3
723.8
551.9
448.4
715.5
506.8
381.6
687.2
487.4
382.6
629.2
735.6
417.6
700.2
547.5
402.4
cients of variation (CVs) for the input variables
from 5 to 30% in steps of 5%.
Variability in the input variables had a large effect on the amount of uncertainty associated with
the estimate of BNPP for all three methods (Figs.
4.2 to 4.4). The CV NFRP for the biomass method
was linearly related to the CVInput (CVNFRP = 5.03
CVrnput) (see Fig. 4.2). A CVrnput of 5% resulted in
a CV NFRP of 25%. By the time the CV Input reached
25%, the CV NFRP was greater than 100%. The CVs
of NFRP for both the nitrogen balance and minirhizotron methods had threshold responses to
CVrnput (see Figs. 4.3 and 4.4). Between CVInput
DFR(t - 1)
MR(t)
DR(t)
P(t)
385.2
0.17
0.15
243
371.5
0.14
0.14
242
432.2
0.15
0.18
-12
353.5
0.16
0.18
166
413.2
0.14
0.14
80
379.0
0.14
0.14
190
358.0
0.16
0.17
152
429.7
0.15
0.15
6
360.3
0.16
0.14
362
372.1
0.15
0.18
349
251.4
0.15
0.17
363
422.2
0.16
0.13
147
340.4
0.16
0.13
139
326.8
0.17
0.13
219
344.3
0.14
0.16
23
369.2
0.13
0.13
99
405.8
0.15
0.12
185
355.1
0.16
0.13
190
429.8
0.14
0.16
217
286.6
0.15
0.15
396
306.1
0.16
0.16
388
384.5
0.14
0.12
402
409.7
0.17
0.11
92
363.2
0.14
0.12
244
352.9
0.13
0.16
334
397.9
0.17
0.15
239
311.2
0.16
0.15
297
380.7
0.15
0.13
277
360.7
0.14
0.16
322
323.6
0.17
0.15
321
316.5
0.14
0.15
320
350.8
0.15
0.15
23
320.7
0.15
0.16
291
of 5 and 20%, the CV NFRP increased linearly from
10 to 44% for the nitrogen balance method and
from 9 to 38% for the minirhizotron method. Between CVInput of 20 to 30%, CV NFRP for the nitrogen balance method increased from 44 to 672% and
CV NFRP for the minirhizotron method increased
from 38 to 181 %. In both cases, a large part of the
reason for the increase is that, as the CV Input becomes large, the probability of selecting a value for
the denominator in the equations very close to zero
also becomes large, causing the result to become
unstable. This emphasizes the sensitivity of these
methods to errors in fine root nitrogen concentra-
67
TABLE 4.4. (continued).
LFR(t)
LFR(t - 1)
DFR(t)
785.5
642.1
420.8
769.0
609.8
398.3
700.0
706.7
341.5
647.3
591.6
393.3
670.0
582.3
339.6
618.8
539.4
431.1
589.2
564.8
418.9
667.6
654.2
351.2
708.7
469.5
428.9
734.1
502.8
417.3
716.4
568.6
415.1
667.3
523.8
364.8
636.4
554.6
345.7
666.3
632.9
461.0
543.1
574.9
338.7
634.3
654.6
434.7
638.8
468.6
370.3
673.3
628.3
446.4
635.8
441.4
378.6
740.6
494.7
388.4
798.4
548.7
389.4
749.1
483.4
469.8
654.1
607.0
404.5
660.6
506.1
405.0
744.7
546.5
425.6
689.3
499.4
380.8
763.4
625.8
417.6
720.5
493.3
374.3
723.8
551.9
448.4
715.5
506.8
381.6
687.2
487.4
382.6
629.2
735.6
417.6
700.2
547.5
402.4
cients of variation (CVs) for the input variables
from 5 to 30% in steps of 5%.
Variability in the input variables had a large effect on the amount of uncertainty associated with
the estimate of BNPP for all three methods (Figs.
4.2 to 4.4). The CV NFRP for the biomass method
was linearly related to the CVInput (CVNFRP = 5.03
CVrnput) (see Fig. 4.2). A CVrnput of 5% resulted in
a CV NFRP of 25%. By the time the CV Input reached
25%, the CV NFRP was greater than 100%. The CVs
of NFRP for both the nitrogen balance and minirhizotron methods had threshold responses to
CVrnput (see Figs. 4.3 and 4.4). Between CVInput
DFR(t - 1)
MR(t)
DR(t)
P(t)
385.2
0.17
0.15
243
371.5
0.14
0.14
242
432.2
0.15
0.18
-12
353.5
0.16
0.18
166
413.2
0.14
0.14
80
379.0
0.14
0.14
190
358.0
0.16
0.17
152
429.7
0.15
0.15
6
360.3
0.16
0.14
362
372.1
0.15
0.18
349
251.4
0.15
0.17
363
422.2
0.16
0.13
147
340.4
0.16
0.13
139
326.8
0.17
0.13
219
344.3
0.14
0.16
23
369.2
0.13
0.13
99
405.8
0.15
0.12
185
355.1
0.16
0.13
190
429.8
0.14
0.16
217
286.6
0.15
0.15
396
306.1
0.16
0.16
388
384.5
0.14
0.12
402
409.7
0.17
0.11
92
363.2
0.14
0.12
244
352.9
0.13
0.16
334
397.9
0.17
0.15
239
311.2
0.16
0.15
297
380.7
0.15
0.13
277
360.7
0.14
0.16
322
323.6
0.17
0.15
321
316.5
0.14
0.15
320
350.8
0.15
0.15
23
320.7
0.15
0.16
291
of 5 and 20%, the CV NFRP increased linearly from
10 to 44% for the nitrogen balance method and
from 9 to 38% for the minirhizotron method. Between CVInput of 20 to 30%, CV NFRP for the nitrogen balance method increased from 44 to 672% and
CV NFRP for the minirhizotron method increased
from 38 to 181 %. In both cases, a large part of the
reason for the increase is that, as the CV Input becomes large, the probability of selecting a value for
the denominator in the equations very close to zero
also becomes large, causing the result to become
unstable. This emphasizes the sensitivity of these
methods to errors in fine root nitrogen concentra-