

3. Global Terrestrial Gross and Net Primary Productivity from the Earth Observing System
49
Landcover
barren
agriculture •
shrub.
grass
ENF.
ONF.
EBF
OBF -
Annual Total
APAR
2500
2000
1500
barren
Radiation Use
Efficiency
0.5
barren
0.4
0.3
0.2
0.1
o
(gC/MJ)
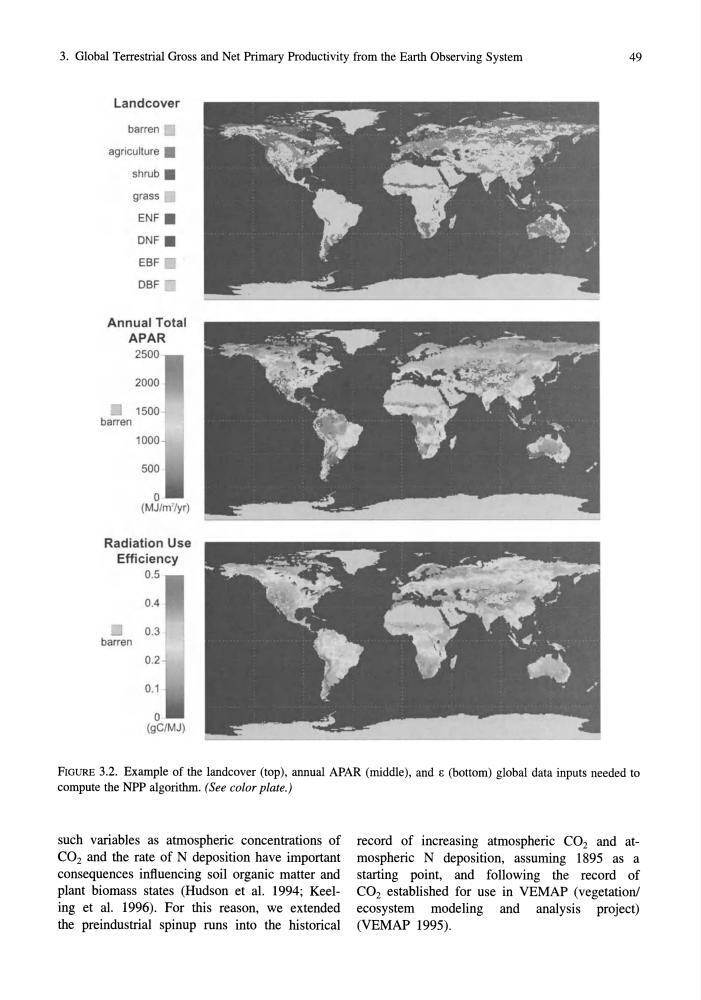
FIGURE 3.2. Example of the landcover (top), annual APAR (middle), and E (bottom) global data inputs needed to
compute the NPP algorithm. (See color plate.)
such variables as atmospheric concentrations of
CO 2 and the rate of N deposition have important
consequences influencing soil organic matter and
plant biomass states (Hudson et al. 1994; Keeling et al. 1996). For this reason, we extended
the preindustrial spinup runs into the historical
record of increasing atmospheric CO 2 and atmospheric N deposition, assuming 1895 as a
starting point, and following the record of
CO2 established for use in VEMAP (vegetation!
ecosystem modeling and analysis project)
(VEMAP 1995).
49
Landcover
barren
agriculture •
shrub.
grass
ENF.
ONF.
EBF
OBF -
Annual Total
APAR
2500
2000
1500
barren
Radiation Use
Efficiency
0.5
barren
0.4
0.3
0.2
0.1
o
(gC/MJ)
FIGURE 3.2. Example of the landcover (top), annual APAR (middle), and E (bottom) global data inputs needed to
compute the NPP algorithm. (See color plate.)
such variables as atmospheric concentrations of
CO 2 and the rate of N deposition have important
consequences influencing soil organic matter and
plant biomass states (Hudson et al. 1994; Keeling et al. 1996). For this reason, we extended
the preindustrial spinup runs into the historical
record of increasing atmospheric CO 2 and atmospheric N deposition, assuming 1895 as a
starting point, and following the record of
CO2 established for use in VEMAP (vegetation!
ecosystem modeling and analysis project)
(VEMAP 1995).