

40
culated as the difference between the mean of the
distribution of B I - BO and the estimated NPP.
Biondini et al. (1991) developed software that,
given the biomass values at times 0 and 1 and the
corresponding standard deviation, calculates OE
and corrected NPP value. The software is free and
available from M. Biondini, North Dakota State
University (biondini@plains.nodak.edu).
Using a similar example, we now show the effect
of decreasing the variance of the biomass estimates
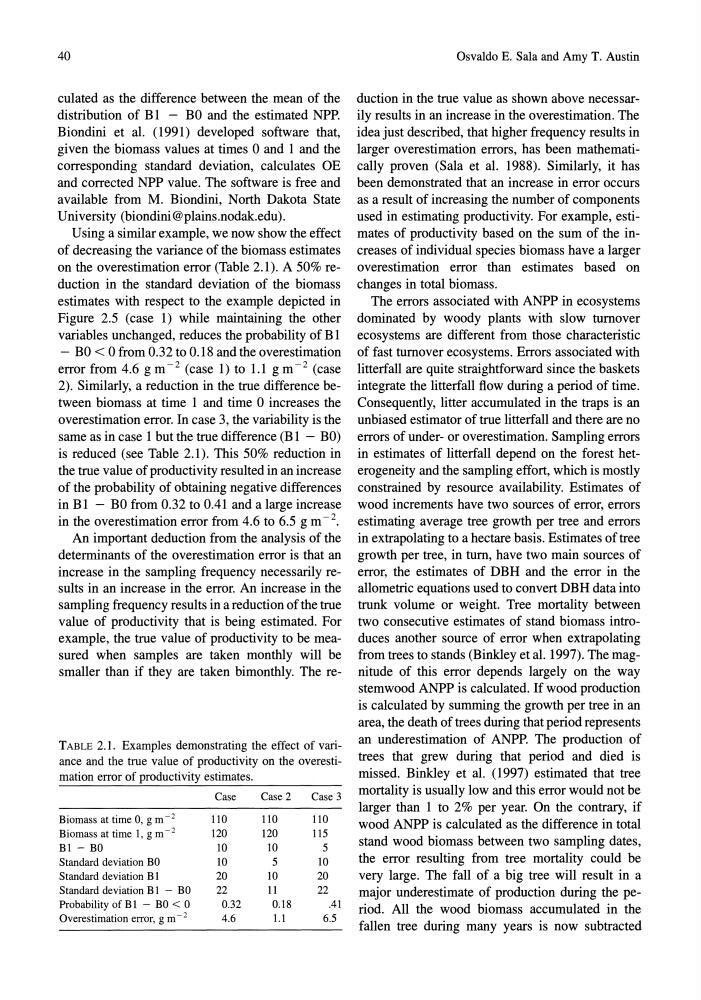
on the overestimation error (Table 2.1). A 50% reduction in the standard deviation of the biomass
estimates with respect to the example depicted in
Figure 2.5 (case 1) while maintaining the other
variables unchanged, reduces the probability of B 1
- BO < 0 from 0.32 to 0.18 and the overestimation
error from 4.6 g m -2 (case 1) to 1.1 g m -2 (case
2). Similarly, a reduction in the true difference between biomass at time 1 and time 0 increases the
overestimation error. In case 3, the variability is the
same as in case 1 but the true difference (B 1 - BO)
is reduced (see Table 2.1). This 50% reduction in
the true value of productivity resulted in an increase
of the probability of obtaining negative differences
in B1 - BO from 0.32 to 0.41 and a large increase
in the overestimation error from 4.6 to 6.5 g m- 2 .
An important deduction from the analysis of the
determinants of the overestimation error is that an
increase in the sampling frequency necessarily results in an increase in the error. An increase in the
sampling frequency results in a reduction of the true
value of productivity that is being estimated. For
example, the true value of productivity to be measured when samples are taken monthly will be
smaller than if they are taken bimonthly. The reTABLE 2.1. Examples demonstrating the effect of variance and the true value of productivity on the overestimation error of productivity estimates.
Case
Case 2
Case 3
Biomass at time 0, g m- 2
110
110
110
Biomass at time 1, g m - 2
120
120
115
Bl - BO
10
10
5
Standard deviation BO
10
5
10
Standard deviation B 1
20
10
20
Standard deviation B 1 - BO
22
11
22
Probability of B 1 - BO < 0
0.32
0.18
Al
Overestimation error, g m - 2
4.6
1.1
6.5
Osvaldo E. Sala and Amy T. Austin
duction in the true value as shown above necessarily results in an increase in the overestimation. The
idea just described, that higher frequency results in
larger overestimation errors, has been mathematically proven (Sala et al. 1988). Similarly, it has
been demonstrated that an increase in error occurs
as a result of increasing the number of components
used in estimating productivity. For example, estimates of productivity based on the sum of the increases of individual species biomass have a larger
overestimation error than estimates based on
changes in total biomass.
The errors associated with ANPP in ecosystems
dominated by woody plants with slow turnover
ecosystems are different from those characteristic
of fast turnover ecosystems. Errors associated with
litterfall are quite straightforward since the baskets
integrate the litterfall flow during a period of time.
Consequently, litter accumulated in the traps is an
unbiased estimator of true litterfall and there are no
errors of under- or overestimation. Sampling errors
in estimates of litterfall depend on the forest heterogeneity and the sampling effort, which is mostly
constrained by resource availability. Estimates of
wood increments have two sources of error, errors
estimating average tree growth per tree and errors
in extrapolating to a hectare basis. Estimates of tree
growth per tree, in tum, have two main sources of
error, the estimates of DBH and the error in the
allometric equations used to convert DBH data into
trunk volume or weight. Tree mortality between
two consecutive estimates of stand biomass introduces another source of error when extrapolating
from trees to stands (Binkley et al. 1997). The magnitude of this error depends largely on the way
stemwood ANPP is calculated. If wood production
is calculated by summing the growth per tree in an
area, the death of trees during that period represents
an underestimation of ANPP. The production of
trees that grew during that period and died is
missed. Binkley et al. (1997) estimated that tree
mortality is usually low and this error would not be
larger than 1 to 2% per year. On the contrary, if
wood ANPP is calculated as the difference in total
stand wood biomass between two sampling dates,
the error resulting from tree mortality could be
very large. The fall of a big tree will result in a
major underestimate of production during the period. All the wood biomass accumulated in the
fallen tree during many years is now subtracted
culated as the difference between the mean of the
distribution of B I - BO and the estimated NPP.
Biondini et al. (1991) developed software that,
given the biomass values at times 0 and 1 and the
corresponding standard deviation, calculates OE
and corrected NPP value. The software is free and
available from M. Biondini, North Dakota State
University (biondini@plains.nodak.edu).
Using a similar example, we now show the effect
of decreasing the variance of the biomass estimates
on the overestimation error (Table 2.1). A 50% reduction in the standard deviation of the biomass
estimates with respect to the example depicted in
Figure 2.5 (case 1) while maintaining the other
variables unchanged, reduces the probability of B 1
- BO < 0 from 0.32 to 0.18 and the overestimation
error from 4.6 g m -2 (case 1) to 1.1 g m -2 (case
2). Similarly, a reduction in the true difference between biomass at time 1 and time 0 increases the
overestimation error. In case 3, the variability is the
same as in case 1 but the true difference (B 1 - BO)
is reduced (see Table 2.1). This 50% reduction in
the true value of productivity resulted in an increase
of the probability of obtaining negative differences
in B1 - BO from 0.32 to 0.41 and a large increase
in the overestimation error from 4.6 to 6.5 g m- 2 .
An important deduction from the analysis of the
determinants of the overestimation error is that an
increase in the sampling frequency necessarily results in an increase in the error. An increase in the
sampling frequency results in a reduction of the true
value of productivity that is being estimated. For
example, the true value of productivity to be measured when samples are taken monthly will be
smaller than if they are taken bimonthly. The reTABLE 2.1. Examples demonstrating the effect of variance and the true value of productivity on the overestimation error of productivity estimates.
Case
Case 2
Case 3
Biomass at time 0, g m- 2
110
110
110
Biomass at time 1, g m - 2
120
120
115
Bl - BO
10
10
5
Standard deviation BO
10
5
10
Standard deviation B 1
20
10
20
Standard deviation B 1 - BO
22
11
22
Probability of B 1 - BO < 0
0.32
0.18
Al
Overestimation error, g m - 2
4.6
1.1
6.5
Osvaldo E. Sala and Amy T. Austin
duction in the true value as shown above necessarily results in an increase in the overestimation. The
idea just described, that higher frequency results in
larger overestimation errors, has been mathematically proven (Sala et al. 1988). Similarly, it has
been demonstrated that an increase in error occurs
as a result of increasing the number of components
used in estimating productivity. For example, estimates of productivity based on the sum of the increases of individual species biomass have a larger
overestimation error than estimates based on
changes in total biomass.
The errors associated with ANPP in ecosystems
dominated by woody plants with slow turnover
ecosystems are different from those characteristic
of fast turnover ecosystems. Errors associated with
litterfall are quite straightforward since the baskets
integrate the litterfall flow during a period of time.
Consequently, litter accumulated in the traps is an
unbiased estimator of true litterfall and there are no
errors of under- or overestimation. Sampling errors
in estimates of litterfall depend on the forest heterogeneity and the sampling effort, which is mostly
constrained by resource availability. Estimates of
wood increments have two sources of error, errors
estimating average tree growth per tree and errors
in extrapolating to a hectare basis. Estimates of tree
growth per tree, in tum, have two main sources of
error, the estimates of DBH and the error in the
allometric equations used to convert DBH data into
trunk volume or weight. Tree mortality between
two consecutive estimates of stand biomass introduces another source of error when extrapolating
from trees to stands (Binkley et al. 1997). The magnitude of this error depends largely on the way
stemwood ANPP is calculated. If wood production
is calculated by summing the growth per tree in an
area, the death of trees during that period represents
an underestimation of ANPP. The production of
trees that grew during that period and died is
missed. Binkley et al. (1997) estimated that tree
mortality is usually low and this error would not be
larger than 1 to 2% per year. On the contrary, if
wood ANPP is calculated as the difference in total
stand wood biomass between two sampling dates,
the error resulting from tree mortality could be
very large. The fall of a big tree will result in a
major underestimate of production during the period. All the wood biomass accumulated in the
fallen tree during many years is now subtracted