

18
Frank W. Davis and Dar Roberts
Lago Cabal iana
Shuttle Imaging Radar: SIR-C
April 16, 1994
CHH,LHH,LHV: RGB
Landsat Thematic Mapper
August 2, 1989
NPV, GV, Soil: RGB
5km
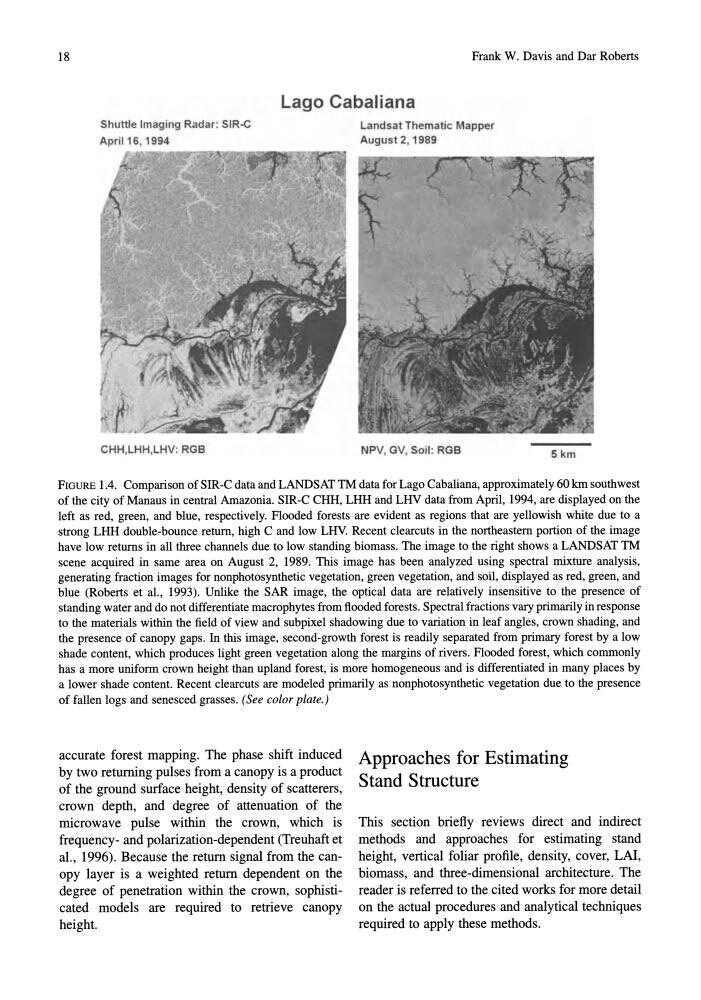
FIGURE 1.4. Comparison of SIR-C data and LANDSAT TM data for Lago Cabaliana, approximately 60 kin southwest
of the city of Manaus in central Amazonia. SIR-C CHH, LHH and LHV data from April, 1994, are displayed on the
left as red, green, and blue, respectively. Flooded forests are evident as regions that are yellowish white due to a
strong LHH double-bounce return, high C and low LHV. Recent clearcuts in the northeastern portion of the image
have low returns in all three channels due to low standing biomass. The image to the right shows a LANDSAT TM
scene acquired in same area on August 2, 1989. This image has been analyzed using spectral mixture analysis,
generating fraction images for nonphotosynthetic vegetation, green vegetation, and soil, displayed as red, green, and
blue (Roberts et al., 1993). Unlike the SAR image, the optical data are relatively insensitive to the presence of
standing water and do not differentiate macrophytes from flooded forests. Spectral fractions vary primarily in response
to the materials within the field of view and sUbpixel shadowing due to variation in leaf angles, crown shading, and
the presence of canopy gaps. In this image, second-growth forest is readily separated from primary forest by a low
shade content, which produces light green vegetation along the margins of rivers. Flooded forest, which commonly
has a more uniform crown height than upland forest, is more homogeneous and is differentiated in many places by
a lower shade content. Recent clearcuts are modeled primarily as nonphotosynthetic vegetation due to the presence
of fallen logs and senesced grasses. (See color plate.)
accurate forest mapping. The phase shift induced
by two returning pulses from a canopy is a product
of the ground surface height, density of scatterers,
crown depth, and degree of attenuation of the
microwave pulse within the crown, which is
frequency- and polarization-dependent (Treuhaft et
aI., 1996). Because the return signal from the canopy layer is a weighted return dependent on the
degree of penetration within the crown, sophisticated models are required to retrieve canopy
height.
Approaches for Estimating
Stand Structure
This section briefly reviews direct and indirect
methods and approaches for estimating stand
height, vertical foliar profile, density, cover, LA!,
biomass, and three-dimensional architecture. The
reader is referred to the cited works for more detail
on the actual procedures and analytical techniques
required to apply these methods.
Frank W. Davis and Dar Roberts
Lago Cabal iana
Shuttle Imaging Radar: SIR-C
April 16, 1994
CHH,LHH,LHV: RGB
Landsat Thematic Mapper
August 2, 1989
NPV, GV, Soil: RGB
5km
FIGURE 1.4. Comparison of SIR-C data and LANDSAT TM data for Lago Cabaliana, approximately 60 kin southwest
of the city of Manaus in central Amazonia. SIR-C CHH, LHH and LHV data from April, 1994, are displayed on the
left as red, green, and blue, respectively. Flooded forests are evident as regions that are yellowish white due to a
strong LHH double-bounce return, high C and low LHV. Recent clearcuts in the northeastern portion of the image
have low returns in all three channels due to low standing biomass. The image to the right shows a LANDSAT TM
scene acquired in same area on August 2, 1989. This image has been analyzed using spectral mixture analysis,
generating fraction images for nonphotosynthetic vegetation, green vegetation, and soil, displayed as red, green, and
blue (Roberts et al., 1993). Unlike the SAR image, the optical data are relatively insensitive to the presence of
standing water and do not differentiate macrophytes from flooded forests. Spectral fractions vary primarily in response
to the materials within the field of view and sUbpixel shadowing due to variation in leaf angles, crown shading, and
the presence of canopy gaps. In this image, second-growth forest is readily separated from primary forest by a low
shade content, which produces light green vegetation along the margins of rivers. Flooded forest, which commonly
has a more uniform crown height than upland forest, is more homogeneous and is differentiated in many places by
a lower shade content. Recent clearcuts are modeled primarily as nonphotosynthetic vegetation due to the presence
of fallen logs and senesced grasses. (See color plate.)
accurate forest mapping. The phase shift induced
by two returning pulses from a canopy is a product
of the ground surface height, density of scatterers,
crown depth, and degree of attenuation of the
microwave pulse within the crown, which is
frequency- and polarization-dependent (Treuhaft et
aI., 1996). Because the return signal from the canopy layer is a weighted return dependent on the
degree of penetration within the crown, sophisticated models are required to retrieve canopy
height.
Approaches for Estimating
Stand Structure
This section briefly reviews direct and indirect
methods and approaches for estimating stand
height, vertical foliar profile, density, cover, LA!,
biomass, and three-dimensional architecture. The
reader is referred to the cited works for more detail
on the actual procedures and analytical techniques
required to apply these methods.