

302
Valerie T. Eviner, F. Stuart Chapin III, and Charles E. Vaughn
tioning of inorganic N among plant uptake, microbial uptake, and chemical fixation in the presence
of plants (Jackson et al. 1989; Norton and Firestone
1996; Recous et al. 1992; Hart et al. 1993); or the
time course of N movement from the inorganic pool
to microbes (including mycorrhizae) to plants
(Buchmann et al. 1996).
Isotopes can be used in a variety of approaches.
If the main objective of the study is to track fertilizer fate, these isotopically labeled fertilizers
should be used. However, if the main objective of
the study is to document changes in nutrient cycling
in response to fertilization, it would be better to
fertilize with unlabeled nutrients, and then add trace
amounts of labeled nutrients to track the movement
of the overall nutrient pool through the system, or
to determine gross rates of nutrient transformations.
Alternatives to Nutrient
Addition Experiments
Nutrient addition experiments are not the only way
to assess nutrient limitation in ecosystems. For example, the NIP ratio in plant tissues is an excellent
indicator of the type of nutrient limitation (Redfield
1958; van den Driessche 1974; Ingestad 1979;
Aerts et al. 1992; Koerselman and Mueleman
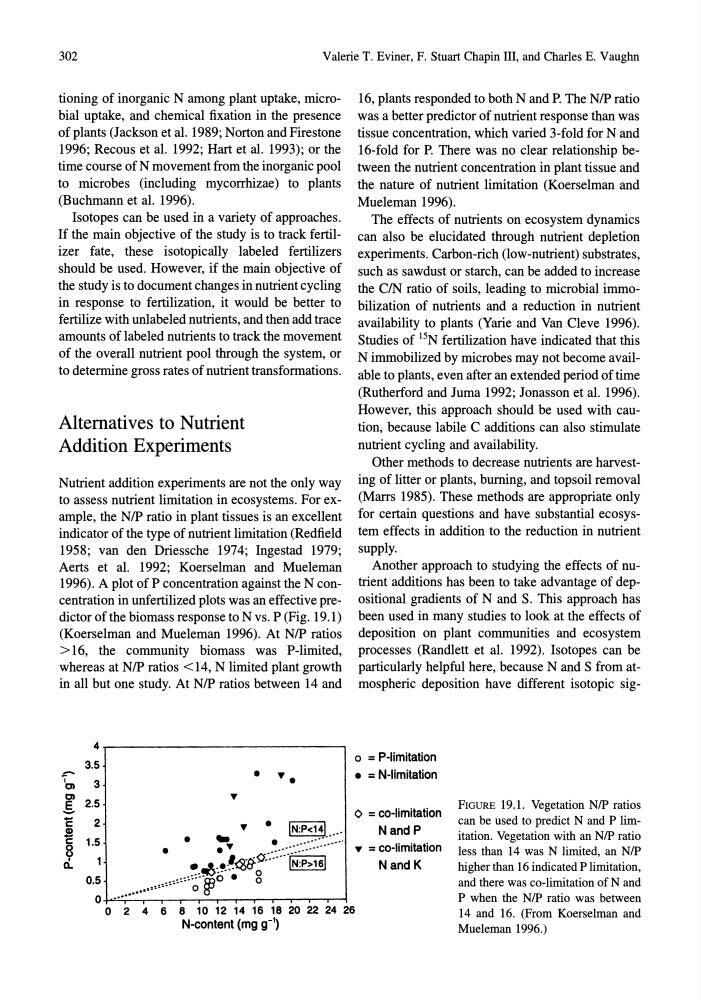
1996). A plot of P concentration against the N concentration in unfertilized plots was an effective predictor of the biomass response to N vs. P (Fig. 19.1)
(Koerselman and Mueleman 1996). At NIP ratios
> 16, the community biomass was P-limited,
whereas at NIP ratios <14, N limited plant growth
in all but one study. At NIP ratios between 14 and
4
3.5
::-- I
3
C)
• ....
C)
2.5
.5- 2
c:
g
c: 1.5
0
u . 1
Q.
... • IN:P<14i.. .. .
.. :-... .~ .... ::::::::: ..... .
~.!I>:~:~161
16, plants responded to both N and P. The NIP ratio
was a better predictor of nutrient response than was
tissue concentration, which varied 3-fold for Nand
16-fold for P. There was no clear relationship between the nutrient concentration in plant tissue and
the nature of nutrient limitation (Koerselman and
Mueleman 1996).
The effects of nutrients on ecosystem dynamics
can also be elucidated through nutrient depletion
experiments. Carbon-rich (low-nutrient) substrates,
such as sawdust or starch, can be added to increase
the C/N ratio of soils, leading to microbial immobilization of nutrients and a reduction in nutrient
availability to plants (Yarie and Van Cleve 1996).
Studies of 15N fertilization have indicated that this
N immobilized by microbes may not become available to plants, even after an extended period of time
(Rutherford and Juma 1992; Jonasson et al. 1996).
However, this approach should be used with caution, because labile C additions can also stimulate
nutrient cycling and availability.
Other methods to decrease nutrients are harvesting of litter or plants, burning, and topsoil removal
(Marrs 1985). These methods are appropriate only
for certain questions and have substantial ecosystem effects in addition to the reduction in nutrient
supply.
Another approach to studying the effects of nutrient additions has been to take advantage of depositional gradients of Nand S. This approach has
been used in many studies to look at the effects of
deposition on plant communities and ecosystem
processes (Randlett et al. 1992). Isotopes can be
particularly helpful here, because N and S from atmospheric deposition have different isotopic sigo = P-limitation
• = N-limitation
o = co-limitation
Nand P
... = co-limitation
NandK
0.5
•• """""'~. {pO. 0
o~··~··r··-··.-.--r~--.-.-.--r~--.-.-~
o 2 4 6 8 10 12 14 16 18 20 22 24 26
N-content (mg g-1)
FIGURE 19.1. Vegetation NIP ratios
can be used to predict N and P limitation. Vegetation with an NIP ratio
less than 14 was N limited, an NIP
higher than 16 indicated P limitation,
and there was co-limitation of Nand
P when the NIP ratio was between
14 and 16. (From Koerselman and
Mueleman 1996.)
Valerie T. Eviner, F. Stuart Chapin III, and Charles E. Vaughn
tioning of inorganic N among plant uptake, microbial uptake, and chemical fixation in the presence
of plants (Jackson et al. 1989; Norton and Firestone
1996; Recous et al. 1992; Hart et al. 1993); or the
time course of N movement from the inorganic pool
to microbes (including mycorrhizae) to plants
(Buchmann et al. 1996).
Isotopes can be used in a variety of approaches.
If the main objective of the study is to track fertilizer fate, these isotopically labeled fertilizers
should be used. However, if the main objective of
the study is to document changes in nutrient cycling
in response to fertilization, it would be better to
fertilize with unlabeled nutrients, and then add trace
amounts of labeled nutrients to track the movement
of the overall nutrient pool through the system, or
to determine gross rates of nutrient transformations.
Alternatives to Nutrient
Addition Experiments
Nutrient addition experiments are not the only way
to assess nutrient limitation in ecosystems. For example, the NIP ratio in plant tissues is an excellent
indicator of the type of nutrient limitation (Redfield
1958; van den Driessche 1974; Ingestad 1979;
Aerts et al. 1992; Koerselman and Mueleman
1996). A plot of P concentration against the N concentration in unfertilized plots was an effective predictor of the biomass response to N vs. P (Fig. 19.1)
(Koerselman and Mueleman 1996). At NIP ratios
> 16, the community biomass was P-limited,
whereas at NIP ratios <14, N limited plant growth
in all but one study. At NIP ratios between 14 and
4
3.5
::-- I
3
C)
• ....
C)
2.5
.5- 2
c:
g
c: 1.5
0
u . 1
Q.
... • IN:P<14i.. .. .
.. :-... .~ .... ::::::::: ..... .
~.!I>:~:~
16, plants responded to both N and P. The NIP ratio
was a better predictor of nutrient response than was
tissue concentration, which varied 3-fold for Nand
16-fold for P. There was no clear relationship between the nutrient concentration in plant tissue and
the nature of nutrient limitation (Koerselman and
Mueleman 1996).
The effects of nutrients on ecosystem dynamics
can also be elucidated through nutrient depletion
experiments. Carbon-rich (low-nutrient) substrates,
such as sawdust or starch, can be added to increase
the C/N ratio of soils, leading to microbial immobilization of nutrients and a reduction in nutrient
availability to plants (Yarie and Van Cleve 1996).
Studies of 15N fertilization have indicated that this
N immobilized by microbes may not become available to plants, even after an extended period of time
(Rutherford and Juma 1992; Jonasson et al. 1996).
However, this approach should be used with caution, because labile C additions can also stimulate
nutrient cycling and availability.
Other methods to decrease nutrients are harvesting of litter or plants, burning, and topsoil removal
(Marrs 1985). These methods are appropriate only
for certain questions and have substantial ecosystem effects in addition to the reduction in nutrient
supply.
Another approach to studying the effects of nutrient additions has been to take advantage of depositional gradients of Nand S. This approach has
been used in many studies to look at the effects of
deposition on plant communities and ecosystem
processes (Randlett et al. 1992). Isotopes can be
particularly helpful here, because N and S from atmospheric deposition have different isotopic sigo = P-limitation
• = N-limitation
o = co-limitation
Nand P
... = co-limitation
NandK
0.5
•• """""'~. {pO. 0
o~··~··r··-··.-.--r~--.-.-.--r~--.-.-~
o 2 4 6 8 10 12 14 16 18 20 22 24 26
N-content (mg g-1)
FIGURE 19.1. Vegetation NIP ratios
can be used to predict N and P limitation. Vegetation with an NIP ratio
less than 14 was N limited, an NIP
higher than 16 indicated P limitation,
and there was co-limitation of Nand
P when the NIP ratio was between
14 and 16. (From Koerselman and
Mueleman 1996.)