

13. Measuring Water Availability and Uptake in Ecosystem Studies
205
soil surface
electromagnetic wave
- + - - - from instrument
reflected
signal energy
TOR
data port
~
&
-=-=~~
j~~~~~- -
lim.
,
instrument~~~~~rt
~o:.\~
computer for viewing,'
good
TOR output
"
,
,
,
,
,
I
reflection from
_
probe end
,
,
,
,
,
,
,
,
,
,
,
,
,
,
Time
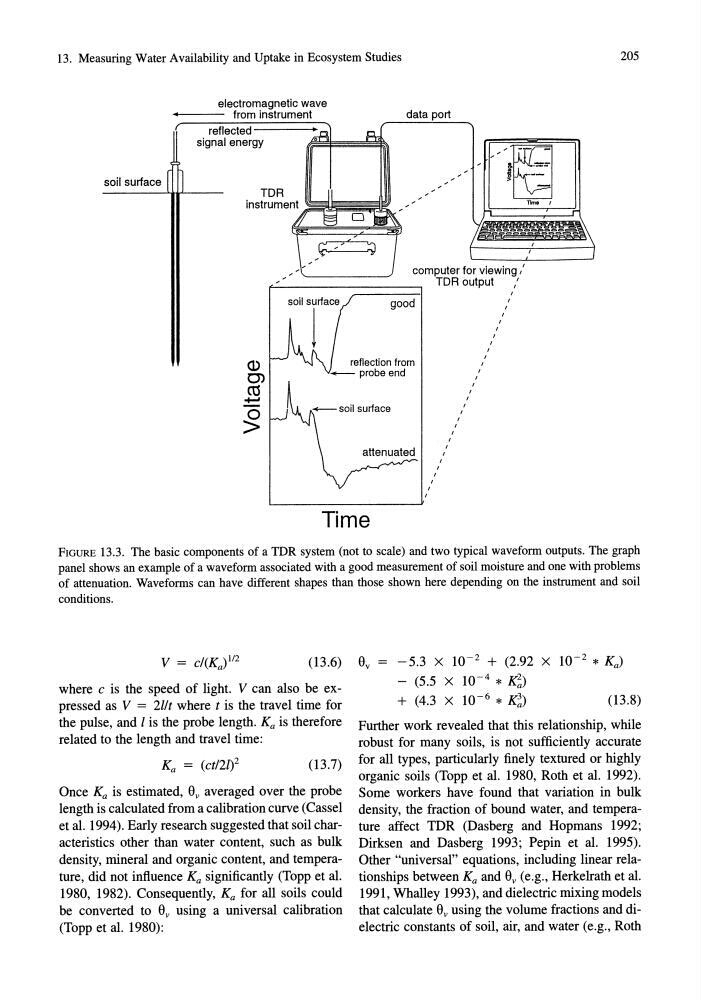
FIGURE 13.3. The basic components of a TDR system (not to scale) and two typical waveform outputs. The graph
panel shows an example of a waveform associated with a good measurement of soil moisture and one with problems
of attenuation. Waveforms can have different shapes than those shown here depending on the instrument and soil
conditions.
(13.6)
where c is the speed of light. V can also be expressed as V = 211t where t is the travel time for
the pulse, and Z is the probe length. Ka is therefore
related to the length and travel time:
Ka = (ct12Zf
(13.7)
Once Ka is estimated, 9v averaged over the probe
length is calculated from a calibration curve (Cassel
et al. 1994). Early research suggested that soil characteristics other than water content, such as bulk
density, mineral and organic content, and temperature, did not influence Ka significantly (Topp et al.
1980, 1982). Consequently, Ka for all soils could
be converted to 9 v using a universal calibration
(Topp et al. 1980):
9y
-5.3 X 10- 2 + (2.92 X 10- 2 * Ka)
(5.5 X 10- 4 * K~)
+ (4.3 X 10- 6 * K~)
(13.8)
Further work revealed that this relationship, while
robust for many soils, is not sufficiently accurate
for all types, particularly finely textured or highly
organic soils (Topp et al. 1980, Roth et al. 1992).
Some workers have found that variation in bulk
density, the fraction of bound water, and temperature affect TDR (Dasberg and Hopmans 1992;
Dirksen and Dasberg 1993; Pepin et al. 1995).
Other "universal" equations, including linear relationships between Ka and 9 v (e.g., Herkelrath et al.
1991, Whalley 1993), and dielectric mixing models
that calculate 9 v using the volume fractions and dielectric constants of soil, air, and water (e.g., Roth
205
soil surface
electromagnetic wave
- + - - - from instrument
reflected
signal energy
TOR
data port
~
&
-=-=~~
j~~~~~- -
lim.
,
instrument~~~~~rt
~o:.\~
computer for viewing,'
good
TOR output
"
,
,
,
,
,
I
reflection from
_
probe end
,
,
,
,
,
,
,
,
,
,
,
,
,
,
Time
FIGURE 13.3. The basic components of a TDR system (not to scale) and two typical waveform outputs. The graph
panel shows an example of a waveform associated with a good measurement of soil moisture and one with problems
of attenuation. Waveforms can have different shapes than those shown here depending on the instrument and soil
conditions.
(13.6)
where c is the speed of light. V can also be expressed as V = 211t where t is the travel time for
the pulse, and Z is the probe length. Ka is therefore
related to the length and travel time:
Ka = (ct12Zf
(13.7)
Once Ka is estimated, 9v averaged over the probe
length is calculated from a calibration curve (Cassel
et al. 1994). Early research suggested that soil characteristics other than water content, such as bulk
density, mineral and organic content, and temperature, did not influence Ka significantly (Topp et al.
1980, 1982). Consequently, Ka for all soils could
be converted to 9 v using a universal calibration
(Topp et al. 1980):
9y
-5.3 X 10- 2 + (2.92 X 10- 2 * Ka)
(5.5 X 10- 4 * K~)
+ (4.3 X 10- 6 * K~)
(13.8)
Further work revealed that this relationship, while
robust for many soils, is not sufficiently accurate
for all types, particularly finely textured or highly
organic soils (Topp et al. 1980, Roth et al. 1992).
Some workers have found that variation in bulk
density, the fraction of bound water, and temperature affect TDR (Dasberg and Hopmans 1992;
Dirksen and Dasberg 1993; Pepin et al. 1995).
Other "universal" equations, including linear relationships between Ka and 9 v (e.g., Herkelrath et al.
1991, Whalley 1993), and dielectric mixing models
that calculate 9 v using the volume fractions and dielectric constants of soil, air, and water (e.g., Roth