

166
John B. Moncrieff, PaulO. Jarvis, and Ricardo Valentini
1.200 r;:=::::;::=.==::::;::=;:=.::::;==.=::::;--------, 1-Fracti on --Cumulativefraclion
1.000 +-1r--------------------I
~
"0 0.800
.~
1i
§ 0.600 +f-~~I_-----------------I
c::
1 0.400 +t--i~-------------------I
i u.
0.200 it-f--......3I~----------------I
0.000
o
200
400
600
800
1000
1200
1400
Distance upwind from tower (m)
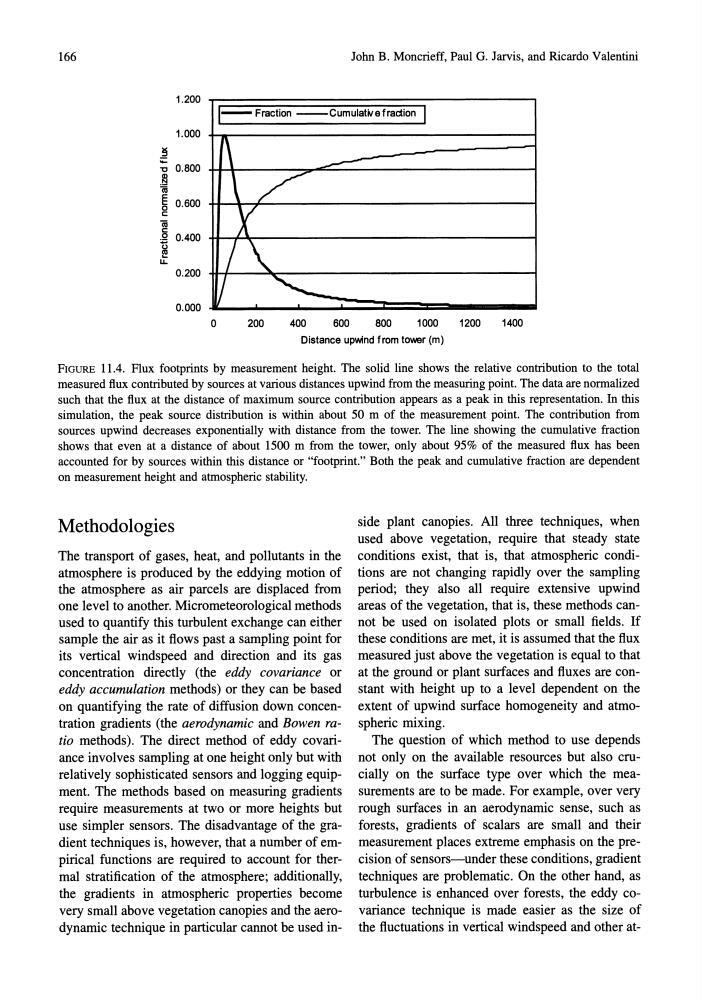
FIGURE 11.4. Flux footprints by measurement height. The solid line shows the relative contribution to the total
measured flux contributed by sources at various distances upwind from the measuring point. The data are normalized
such that the flux at the distance of maximum source contribution appears as a peak in this representation. In this
simulation, the peak source distribution is within about 50 m of the measurement point. The contribution from
sources upwind decreases exponentially with distance from the tower. The line showing the cumulative fraction
shows that even at a distance of about 1500 m from the tower, only about 95% of the measured flux has been
accounted for by sources within this distance or "footprint." Both the peak and cumulative fraction are dependent
on measurement height and atmospheric stability.
Methodologies
The transport of gases, heat, and pollutants in the
atmosphere is produced by the eddying motion of
the atmosphere as air parcels are displaced from
one level to another. Micrometeorological methods
used to quantify this turbulent exchange can either
sample the air as it flows past a sampling point for
its vertical windspeed and direction and its gas
concentration directly (the eddy covariance or
eddy accumulation methods) or they can be based
on quantifying the rate of diffusion down concentration gradients (the aerodynamic and Bowen ratio methods). The direct method of eddy covariance involves sampling at one height only but with
relatively sophisticated sensors and logging equipment. The methods based on measuring gradients
require measurements at two or more heights but
use simpler sensors. The disadvantage of the gradient techniques is, however, that a number of empirical functions are required to account for thermal stratification of the atmosphere; additionally,
the gradients in atmospheric properties become
very small above vegetation canopies and the aerodynamic technique in particular cannot be used inside plant canopies. All three techniques, when
used above vegetation, require that steady state
conditions exist, that is, that atmospheric conditions are not changing rapidly over the sampling
period; they also all require extensive upwind
areas of the vegetation, that is, these methods cannot be used on isolated plots or small fields. If
these conditions are met, it is assumed that the flux
measured just above the vegetation is equal to that
at the ground or plant surfaces and fluxes are constant with height up to a level dependent on the
extent of upwind surface homogeneity and atmospheric mixing.
The question of which method to use depends
not only on the available resources but also crucially on the surface type over which the measurements are to be made. For example, over very
rough surfaces in an aerodynamic sense, such as
forests, gradients of scalars are small and their
measurement places extreme emphasis on the precision of sensors-under these conditions, gradient
techniques are problematic. On the other hand, as
turbulence is enhanced over forests, the eddy covariance technique is made easier as the size of
the fluctuations in vertical windspeed and other at-
John B. Moncrieff, PaulO. Jarvis, and Ricardo Valentini
1.200 r;:=::::;::=.==::::;::=;:=.::::;==.=::::;--------, 1-Fracti on --Cumulativefraclion
1.000 +-1r--------------------I
~
"0 0.800
.~
1i
§ 0.600 +f-~~I_-----------------I
c::
1 0.400 +t--i~-------------------I
i u.
0.200 it-f--......3I~----------------I
0.000
o
200
400
600
800
1000
1200
1400
Distance upwind from tower (m)
FIGURE 11.4. Flux footprints by measurement height. The solid line shows the relative contribution to the total
measured flux contributed by sources at various distances upwind from the measuring point. The data are normalized
such that the flux at the distance of maximum source contribution appears as a peak in this representation. In this
simulation, the peak source distribution is within about 50 m of the measurement point. The contribution from
sources upwind decreases exponentially with distance from the tower. The line showing the cumulative fraction
shows that even at a distance of about 1500 m from the tower, only about 95% of the measured flux has been
accounted for by sources within this distance or "footprint." Both the peak and cumulative fraction are dependent
on measurement height and atmospheric stability.
Methodologies
The transport of gases, heat, and pollutants in the
atmosphere is produced by the eddying motion of
the atmosphere as air parcels are displaced from
one level to another. Micrometeorological methods
used to quantify this turbulent exchange can either
sample the air as it flows past a sampling point for
its vertical windspeed and direction and its gas
concentration directly (the eddy covariance or
eddy accumulation methods) or they can be based
on quantifying the rate of diffusion down concentration gradients (the aerodynamic and Bowen ratio methods). The direct method of eddy covariance involves sampling at one height only but with
relatively sophisticated sensors and logging equipment. The methods based on measuring gradients
require measurements at two or more heights but
use simpler sensors. The disadvantage of the gradient techniques is, however, that a number of empirical functions are required to account for thermal stratification of the atmosphere; additionally,
the gradients in atmospheric properties become
very small above vegetation canopies and the aerodynamic technique in particular cannot be used inside plant canopies. All three techniques, when
used above vegetation, require that steady state
conditions exist, that is, that atmospheric conditions are not changing rapidly over the sampling
period; they also all require extensive upwind
areas of the vegetation, that is, these methods cannot be used on isolated plots or small fields. If
these conditions are met, it is assumed that the flux
measured just above the vegetation is equal to that
at the ground or plant surfaces and fluxes are constant with height up to a level dependent on the
extent of upwind surface homogeneity and atmospheric mixing.
The question of which method to use depends
not only on the available resources but also crucially on the surface type over which the measurements are to be made. For example, over very
rough surfaces in an aerodynamic sense, such as
forests, gradients of scalars are small and their
measurement places extreme emphasis on the precision of sensors-under these conditions, gradient
techniques are problematic. On the other hand, as
turbulence is enhanced over forests, the eddy covariance technique is made easier as the size of
the fluctuations in vertical windspeed and other at-