

108
position in most environments, so there is, in fact,
considerable value for extending studies to >5
years (Harmon et al. 1999).
At least 4 to 5 litter bags should be retrieved at
each sampling interval for each experimental or
landscape replicate, which should be chosen to
avoid pseudoreplication. Thus, it is not uncommon
to deploy 100 or more litter bags to appropriately
characterize decomposition within an ecosystem.
For postcollection chemical analyses it may be appropriate to composite samples after drying and
weighing. Samples to be chemically analyzed
should be dried at 55°C to avoid heat-induced
chemical changes in C content. Both litter mass and
sometimes chemical content must be corrected for
contaminating soil that is commonly collected with
the litter bags, especially at later stages of decomposition. Mass can be corrected by combusting
each sample and calculating an ash-free dry mass
proportion to estimate the litter versus soil portion
of the sample. Where contaminating soil has a high
organic matter content or can affect nutrient analyses, a more involved correction is necessary (Blair
1988; Harmon et al. 1999).
G. Philip Robertson and Eldor A. Paul
The decomposition rate constant k can usually be
calculated by fitting mass loss to the single negative
exponential model (Jenny et al. 1949; Olson 1963):
(7.1)
where x/xo is the proportion of original mass remaining at time t, t is elapsed time in years, and k
is the decomposition rate constant.
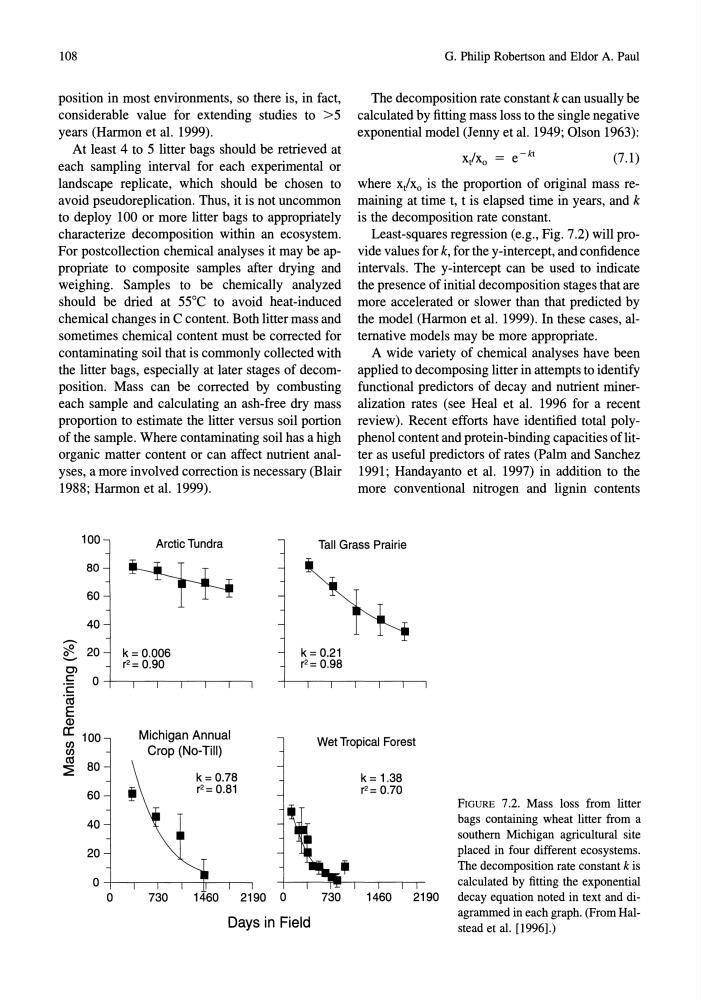
Least-squares regression (e.g., Fig. 7.2) will provide values for k, for the y-intercept, and confidence
intervals. The y-intercept can be used to indicate
the presence of initial decomposition stages that are
more accelerated or slower than that predicted by
the model (Harmon et al. 1999). In these cases, alternative models may be more appropriate.
A wide variety of chemical analyses have been
applied to decomposing litter in attempts to identify
functional predictors of decay and nutrient mineralization rates (see Heal et al. 1996 for a recent
review). Recent efforts have identified total polyphenol content and protein-binding capacities oflitter as useful predictors of rates (Palm and Sanchez
1991; Handayanto et al. 1997) in addition to the
more conventional nitrogen and lignin contents
100
Arctic Tundra
Tall Grass Prairie
~
~
Ol
c:
c:
·co
E Q)
80
60
40
20
0
k = 0.006
r2 = 0.90
k = 0.21
1"' 1= 0.98
a::: 100
en
Michigan Annual
Crop (No-Till)
Wet Tropical Forest
en
ro 80
~
60
40
20
0
0
730
k = 0.78
1"'1=0.81
1460
2190 0
730
Days in Field
k = 1.38
1"' 1= 0.70
FIGURE 7.2. Mass loss from litter
bags containing wheat litter from a
southern Michigan agricultural site
placed in four different ecosystems.
The decomposition rate constant k is
calculated by fitting the exponential
1460
2190
decay equation noted in text and diagrammed in each graph. (From Halstead et al. [1996].)
position in most environments, so there is, in fact,
considerable value for extending studies to >5
years (Harmon et al. 1999).
At least 4 to 5 litter bags should be retrieved at
each sampling interval for each experimental or
landscape replicate, which should be chosen to
avoid pseudoreplication. Thus, it is not uncommon
to deploy 100 or more litter bags to appropriately
characterize decomposition within an ecosystem.
For postcollection chemical analyses it may be appropriate to composite samples after drying and
weighing. Samples to be chemically analyzed
should be dried at 55°C to avoid heat-induced
chemical changes in C content. Both litter mass and
sometimes chemical content must be corrected for
contaminating soil that is commonly collected with
the litter bags, especially at later stages of decomposition. Mass can be corrected by combusting
each sample and calculating an ash-free dry mass
proportion to estimate the litter versus soil portion
of the sample. Where contaminating soil has a high
organic matter content or can affect nutrient analyses, a more involved correction is necessary (Blair
1988; Harmon et al. 1999).
G. Philip Robertson and Eldor A. Paul
The decomposition rate constant k can usually be
calculated by fitting mass loss to the single negative
exponential model (Jenny et al. 1949; Olson 1963):
(7.1)
where x/xo is the proportion of original mass remaining at time t, t is elapsed time in years, and k
is the decomposition rate constant.
Least-squares regression (e.g., Fig. 7.2) will provide values for k, for the y-intercept, and confidence
intervals. The y-intercept can be used to indicate
the presence of initial decomposition stages that are
more accelerated or slower than that predicted by
the model (Harmon et al. 1999). In these cases, alternative models may be more appropriate.
A wide variety of chemical analyses have been
applied to decomposing litter in attempts to identify
functional predictors of decay and nutrient mineralization rates (see Heal et al. 1996 for a recent
review). Recent efforts have identified total polyphenol content and protein-binding capacities oflitter as useful predictors of rates (Palm and Sanchez
1991; Handayanto et al. 1997) in addition to the
more conventional nitrogen and lignin contents
100
Arctic Tundra
Tall Grass Prairie
~
~
Ol
c:
c:
·co
E Q)
80
60
40
20
0
k = 0.006
r2 = 0.90
k = 0.21
1"' 1= 0.98
a::: 100
en
Michigan Annual
Crop (No-Till)
Wet Tropical Forest
en
ro 80
~
60
40
20
0
0
730
k = 0.78
1"'1=0.81
1460
2190 0
730
Days in Field
k = 1.38
1"' 1= 0.70
FIGURE 7.2. Mass loss from litter
bags containing wheat litter from a
southern Michigan agricultural site
placed in four different ecosystems.
The decomposition rate constant k is
calculated by fitting the exponential
1460
2190
decay equation noted in text and diagrammed in each graph. (From Halstead et al. [1996].)