

58
B. Manca et al.
ly continues to flow northwards, driven by a
coherent current generated by an anticyclone
near the eastern coast. Only the portion of saline
water which lies in the upper 120 m layer reaches the Northern Adriatic generating the pressure
gradients responsible for the general Adriatic
cyclonic circulation. The anticyclonic eddy has
been consistently observed during all the surveys. The general features of the circulation at
the surface do not change significantly with
depth, indicating the strong barotropic character
of the southern gyre.
One of the major questions concerning the
hydrography of the Adriatic Sea is the definition
of the water exchange at the Pelagosa sill, which
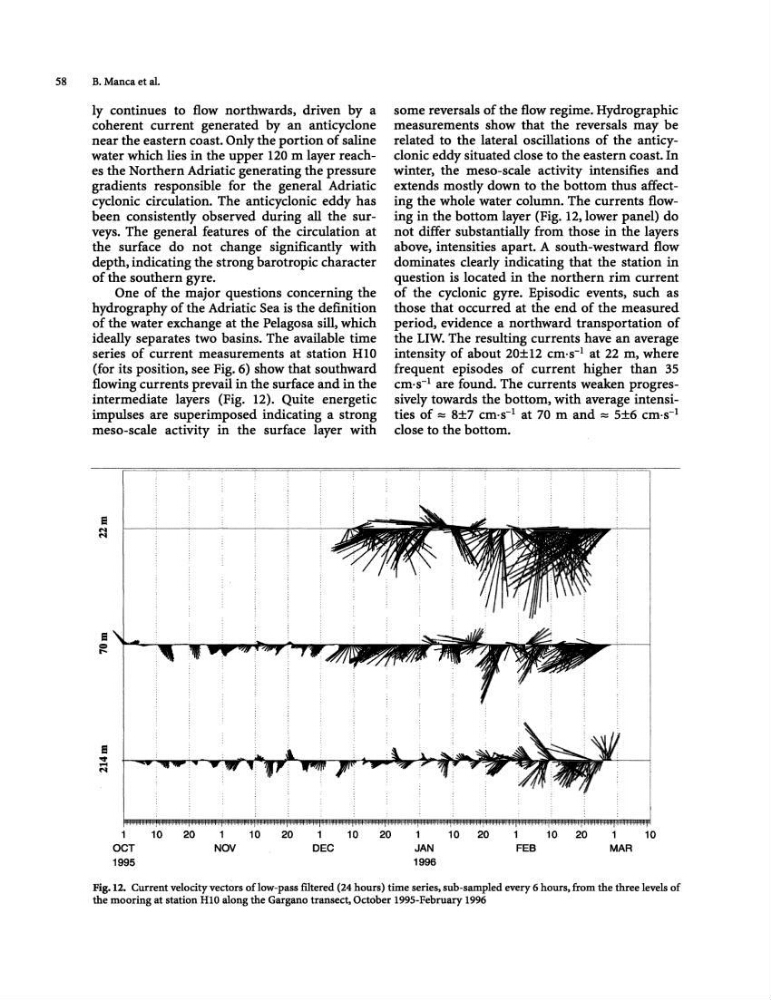
ideally separates two basins. The available time
series of current measurements at station RIO
(for its position, see Fig. 6) show that southward
flowing currents prevail in the surface and in the
intermediate layers (Fig. 12). Quite energetic
impulses are superimposed indicating a strong
meso-scale activity in the surface layer with
1
10
20
1
10
20
1
10
20
OCT
NOV
DEC
1995
some reversals of the flow regime. Hydrographic
measurements show that the reversals may be
related to the lateral oscillations of the anticyclonic eddy situated close to the eastern coast. In
winter, the meso-scale activity intensifies and
extends mostly down to the bottom thus affecting the whole water column. The currents flowing in the bottom layer (Fig. 12, lower panel) do
not differ substantially from those in the layers
above. intensities apart. A south-westward flow
dominates clearly indicating that the station in
question is located in the northern rim current
of the cyclonic gyre. Episodic events, such as
those that occurred at the end of the measured
period, evidence a northward transportation of
the LIW. The resulting currents have an average
intensity of about 20±12 cm·s- 1 at 22 m, where
frequent episodes of current higher than 35
cm·s- 1 are found. The currents weaken progressively towards the bottom, with average intensities of =:: 8±7 cm·s- 1 at 70 m and =:: 5±6 cm·s- 1
dose to the bottom.
JAN
1996
10
20
FEB
10
20
10
MAR
Fig.12. Current velocity vectors oflaw-pass filtered (24 hours) time series, sub-sampled every 6 hours, from the three levels of
the mooring at station RlO along the Gargano transect. October 1995-February 1996
B. Manca et al.
ly continues to flow northwards, driven by a
coherent current generated by an anticyclone
near the eastern coast. Only the portion of saline
water which lies in the upper 120 m layer reaches the Northern Adriatic generating the pressure
gradients responsible for the general Adriatic
cyclonic circulation. The anticyclonic eddy has
been consistently observed during all the surveys. The general features of the circulation at
the surface do not change significantly with
depth, indicating the strong barotropic character
of the southern gyre.
One of the major questions concerning the
hydrography of the Adriatic Sea is the definition
of the water exchange at the Pelagosa sill, which
ideally separates two basins. The available time
series of current measurements at station RIO
(for its position, see Fig. 6) show that southward
flowing currents prevail in the surface and in the
intermediate layers (Fig. 12). Quite energetic
impulses are superimposed indicating a strong
meso-scale activity in the surface layer with
1
10
20
1
10
20
1
10
20
OCT
NOV
DEC
1995
some reversals of the flow regime. Hydrographic
measurements show that the reversals may be
related to the lateral oscillations of the anticyclonic eddy situated close to the eastern coast. In
winter, the meso-scale activity intensifies and
extends mostly down to the bottom thus affecting the whole water column. The currents flowing in the bottom layer (Fig. 12, lower panel) do
not differ substantially from those in the layers
above. intensities apart. A south-westward flow
dominates clearly indicating that the station in
question is located in the northern rim current
of the cyclonic gyre. Episodic events, such as
those that occurred at the end of the measured
period, evidence a northward transportation of
the LIW. The resulting currents have an average
intensity of about 20±12 cm·s- 1 at 22 m, where
frequent episodes of current higher than 35
cm·s- 1 are found. The currents weaken progressively towards the bottom, with average intensities of =:: 8±7 cm·s- 1 at 70 m and =:: 5±6 cm·s- 1
dose to the bottom.
JAN
1996
10
20
FEB
10
20
10
MAR
Fig.12. Current velocity vectors oflaw-pass filtered (24 hours) time series, sub-sampled every 6 hours, from the three levels of
the mooring at station RlO along the Gargano transect. October 1995-February 1996