

56
B. Manea et al.
a
c
Z
Ql
43.5
42.5
a 4 1.5
j
Z
Ql
40.5
39.S
16.0
43.5
42.5
~ 4 1,5
j
40.5
~ '0 . .().06
''Q
0.02 .
-0.04 .
r:,'i1' .
'G! I..,
.. : :~~; : .~~~:: :: :~~: : .:.
-0. 0 <, ••••••• ' .• • ••••••• • •
.
~
a
170
' ..g ,04
• '? ' '0 . ~. "c!> '
:S····y·
18 .0
Longitude E
' 9.0
Spring '95: Geopotential Anomaly-Reference
Level 100 dbar
iJ
9
. , ' ' 0
. . . ~
.p'
. ' -~ .... ~
z
OJ
43.5
42.5
-g 41 .5
.~
...J
40.5
39.S
20J)
IS()
z
OJ
43.5
4~.S
-a 41.5
~
40.S
' 1.0
18 .0
Longitude E
19 .0
Summer '95: Potential Anomaly
at Surface-Reference Level 100 dbar
<:> •
"«;,.
:g
Q
9 . ~ · · "' ;::
- ;:;
d
20.0
39.5+------'''-r--- - - , - - - - -,-----...1..I.-, 39.5-+-----""-r------r-----r----~
16.0
17.0
18.0
Longitude E
190
Autumn '95: Geopotential Anomaly
at Surface-Reference Levell OOdbar
20.0
16 .0
17.0
180
Longitude E
19.0
Winter '96: Geopotential Anomaly
at Surface-Reference Level 100 dbar
20.0
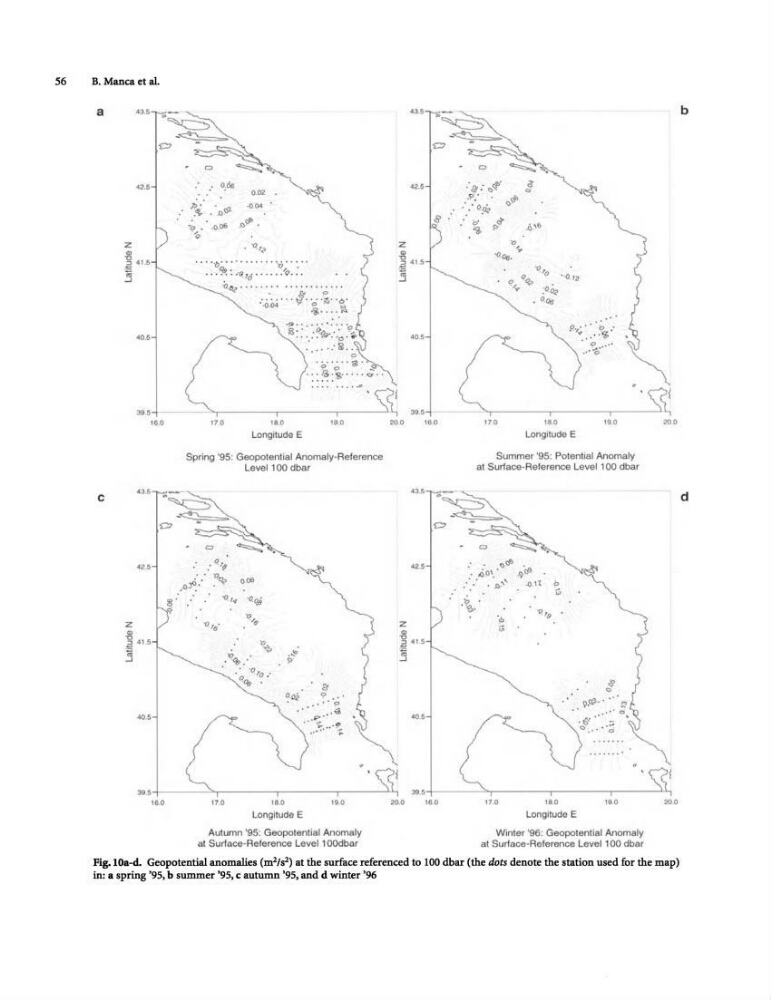
Fig.lOa-d. Geopotential anomalies (m 2 /s2) at the surface referenced to 100 dbar (the dots denote the station used for the map)
in: a spring '95, b summer '95, c autumn '95, and d winter '96
b
d
B. Manea et al.
a
c
Z
Ql
43.5
42.5
a 4 1.5
j
Z
Ql
40.5
39.S
16.0
43.5
42.5
~ 4 1,5
j
40.5
~ '0 . .().06
''Q
0.02 .
-0.04 .
r:,'i1' .
'G! I..,
.. : :~~; : .~~~:: :: :~~: : .:.
-0. 0 <, ••••••• ' .• • ••••••• • •
.
~
a
170
' ..g ,04
• '? ' '0 . ~. "c!> '
:S····y·
18 .0
Longitude E
' 9.0
Spring '95: Geopotential Anomaly-Reference
Level 100 dbar
iJ
9
. , ' ' 0
. . . ~
.p'
. ' -~ .... ~
z
OJ
43.5
42.5
-g 41 .5
.~
...J
40.5
39.S
20J)
IS()
z
OJ
43.5
4~.S
-a 41.5
~
40.S
' 1.0
18 .0
Longitude E
19 .0
Summer '95: Potential Anomaly
at Surface-Reference Level 100 dbar
<:> •
"«;,.
:g
Q
9 . ~ · · "' ;::
- ;:;
d
20.0
39.5+------'''-r--- - - , - - - - -,-----...1..I.-, 39.5-+-----""-r------r-----r----~
16.0
17.0
18.0
Longitude E
190
Autumn '95: Geopotential Anomaly
at Surface-Reference Levell OOdbar
20.0
16 .0
17.0
180
Longitude E
19.0
Winter '96: Geopotential Anomaly
at Surface-Reference Level 100 dbar
20.0
Fig.lOa-d. Geopotential anomalies (m 2 /s2) at the surface referenced to 100 dbar (the dots denote the station used for the map)
in: a spring '95, b summer '95, c autumn '95, and d winter '96
b
d