

Dissolved Nitrogen and Phosphorus Behaviour in the Northwestern Adriatic Sea
41
a
-1
......
E
- :a
-2
Q)
0
b
-1
- E
- J:: -2
a. CD
0
o
•
10
20
Distance (miles)
•
•
•
•
EF24
•
•
•
•
30
o
10
20
Distance (miles)
0.03
30
c
d
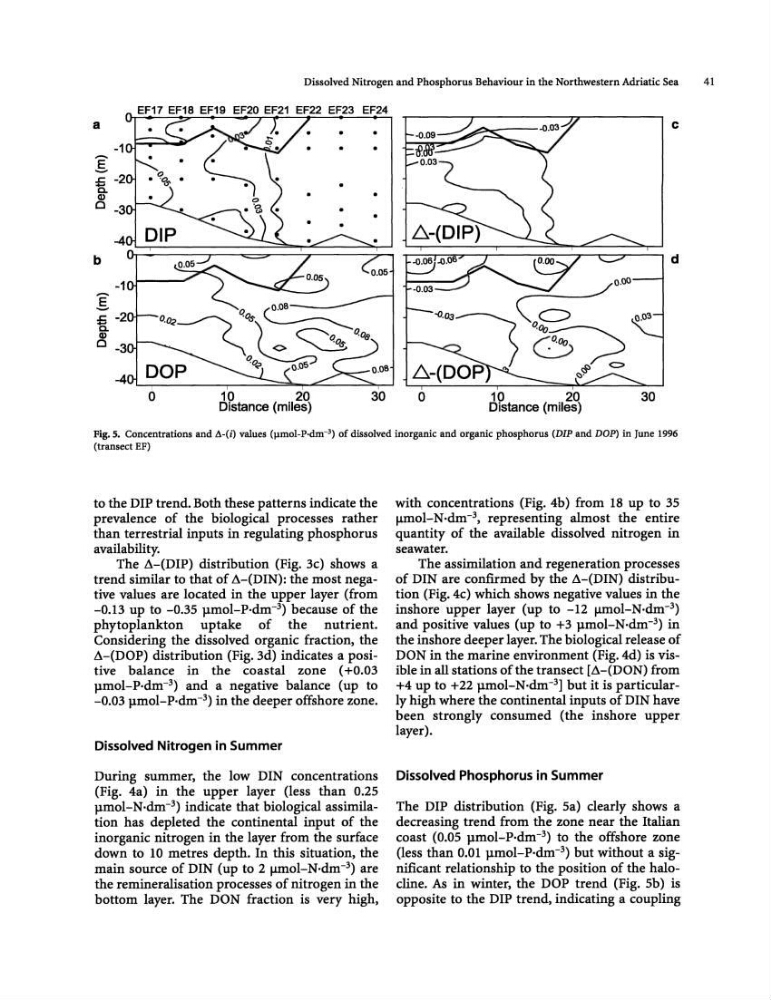
Fig.5. Concentrations and b-(i) values (pmol-P.dm- 3 ) of dissolved inorganic and organic phosphorus (DIP and DOP) in June 1996
(transect EF)
to the DIP trend. Both these patterns indicate the
prevalence of the biological processes rather
than terrestrial inputs in regulating phosphorus
availability.
The L\-(DIP) distribution (Fig. 3c) shows a
trend similar to that of L\-(DIN): the most negative values are located in the upper layer (from
-0.13 up to -0.35 p.mol-P·dm- 3 ) because of the
phytoplankton uptake of the nutrient.
Considering the dissolved organic fraction, the
L\-(DOP) distribution (Fig. 3d) indicates a positive balance in the coastal zone ( +0.03
p.mol-P·dm<3) and a negative balance (up to
-0.03 p.mol-P·dm- 3 ) in the deeper offshore zone.
Dissolved Nitrogen in Summer
During summer, the low DIN concentrations
(Fig. 4a) in the upper layer (less than 0.25
p.mol-N·dm- 3 ) indicate that biological assimilation has depleted the continental input of the
inorganic nitrogen in the layer from the surface
down to 10 metres depth. In this situation, the
main source of DIN (up to 2 fJIDol-N·dm-') are
the remineralisation processes of nitrogen in the
bottom layer. The DON fraction is very high,
with concentrations (Fig.4b) from 18 up to 35
fJIDol-N·dm-3, representing almost the entire
quantity of the available dissolved nitrogen in
seawater.
The assimilation and regeneration processes
of DIN are confirmed by the L\-(DIN) distribution (Fig. 4c) which shows negative values in the
inshore upper layer (up to -12 fJIDol-N·dm-3)
and positive values (up to +3 p.mol-N·dm- 3 ) in
the inshore deeper layer. The biological release of
DON in the marine environment (Fig. 4d) is visible in all stations of the transect [A-(DON) from
+4 up to +22 p.mol-N·dm- 3 ] but it is particularly high where the continental inputs of DIN have
been strongly consumed (the inshore upper
layer).
Dissolved Phosphorus in Summer
The DIP distribution (Fig. Sa) clearly shows a
decreasing trend from the zone near the Italian
coast (0.05 p.mol-P.dm- 3 ) to the offshore zone
(less than 0.01 pmol-P·dm-') but without a significant relationship to the position of the halocline. As in winter, the DOP trend (Fig. 5b) is
opposite to the DIP trend, indicating a coupling
41
a
-1
......
E
- :a
-2
Q)
0
b
-1
- E
- J:: -2
a. CD
0
o
•
10
20
Distance (miles)
•
•
•
•
EF24
•
•
•
•
30
o
10
20
Distance (miles)
0.03
30
c
d
Fig.5. Concentrations and b-(i) values (pmol-P.dm- 3 ) of dissolved inorganic and organic phosphorus (DIP and DOP) in June 1996
(transect EF)
to the DIP trend. Both these patterns indicate the
prevalence of the biological processes rather
than terrestrial inputs in regulating phosphorus
availability.
The L\-(DIP) distribution (Fig. 3c) shows a
trend similar to that of L\-(DIN): the most negative values are located in the upper layer (from
-0.13 up to -0.35 p.mol-P·dm- 3 ) because of the
phytoplankton uptake of the nutrient.
Considering the dissolved organic fraction, the
L\-(DOP) distribution (Fig. 3d) indicates a positive balance in the coastal zone ( +0.03
p.mol-P·dm<3) and a negative balance (up to
-0.03 p.mol-P·dm- 3 ) in the deeper offshore zone.
Dissolved Nitrogen in Summer
During summer, the low DIN concentrations
(Fig. 4a) in the upper layer (less than 0.25
p.mol-N·dm- 3 ) indicate that biological assimilation has depleted the continental input of the
inorganic nitrogen in the layer from the surface
down to 10 metres depth. In this situation, the
main source of DIN (up to 2 fJIDol-N·dm-') are
the remineralisation processes of nitrogen in the
bottom layer. The DON fraction is very high,
with concentrations (Fig.4b) from 18 up to 35
fJIDol-N·dm-3, representing almost the entire
quantity of the available dissolved nitrogen in
seawater.
The assimilation and regeneration processes
of DIN are confirmed by the L\-(DIN) distribution (Fig. 4c) which shows negative values in the
inshore upper layer (up to -12 fJIDol-N·dm-3)
and positive values (up to +3 p.mol-N·dm- 3 ) in
the inshore deeper layer. The biological release of
DON in the marine environment (Fig. 4d) is visible in all stations of the transect [A-(DON) from
+4 up to +22 p.mol-N·dm- 3 ] but it is particularly high where the continental inputs of DIN have
been strongly consumed (the inshore upper
layer).
Dissolved Phosphorus in Summer
The DIP distribution (Fig. Sa) clearly shows a
decreasing trend from the zone near the Italian
coast (0.05 p.mol-P.dm- 3 ) to the offshore zone
(less than 0.01 pmol-P·dm-') but without a significant relationship to the position of the halocline. As in winter, the DOP trend (Fig. 5b) is
opposite to the DIP trend, indicating a coupling