

Dissolved Nitrogen and Phosphorus Behaviour in the Northwestern Adriatic Sea
39
Results and Discussion
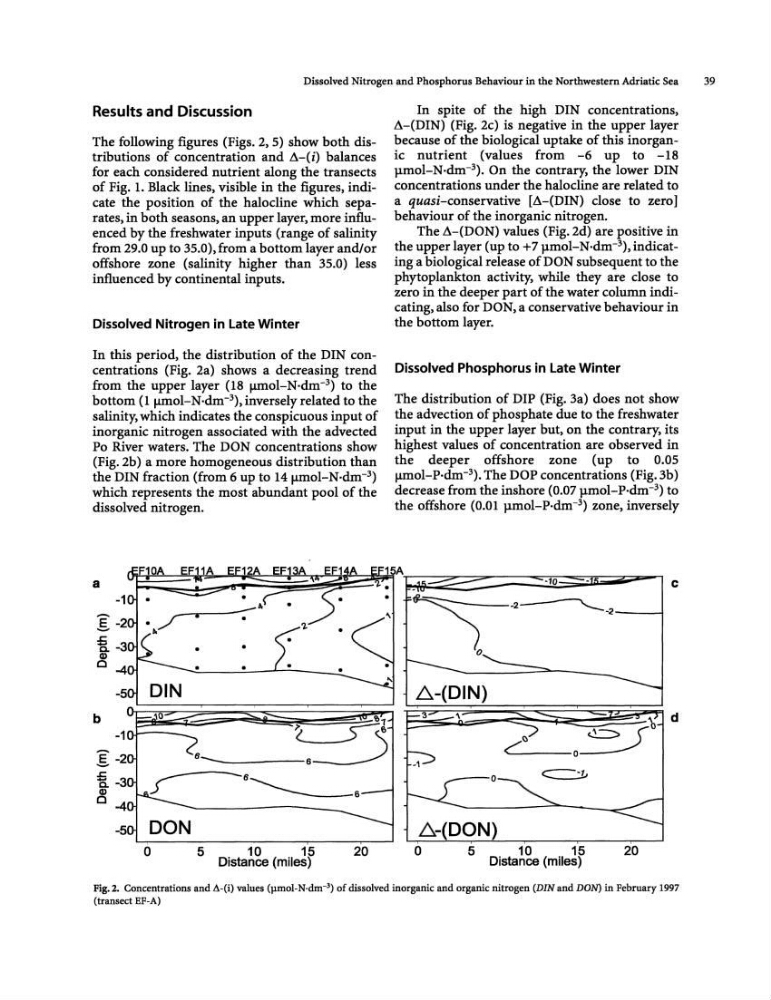
The following figures (Figs. 2, 5) show both distributions of concentration and 6-(i) balances
for each considered nutrient along the transects
of Fig. 1. Black lines, visible in the figures, indicate the position of the halo cline which separates, in both seasons, an upper layer, more influenced by the freshwater inputs (range of salinity
from 29.0 up to 35.0), from a bottom layer and/or
offshore zone (salinity higher than 35.0) less
influenced by continental inputs.
Dissolved Nitrogen in Late Winter
In this period. the distribution of the DIN concentrations (Fig. 2a) shows a decreasing trend
from the upper layer (18 JlIIlol-N·dm- 3 ) to the
bottom (I JlIIlol-N·dm- 3 ), inversely related to the
salinity, which indicates the conspicuous input of
inorganic nitrogen associated with the advected
Po River waters. The DON concentrations show
(Fig. 2b) a more homogeneous distribution than
the DIN fraction (from 6 up to 14 JLmol-N·dm- 3 )
which represents the most abundant pool of the
dissolved nitrogen.
In spite of the high DIN concentrations,
A-(DIN) (Fig. 2c) is negative in the upper layer
because of the biological uptake of this inorganic nutrient (values from -6 up to -18
pmol-N.dm- 3 ). On the contrary. the lower DIN
concentrations under the halocline are related to
a quasi-conservative [A-(DIN) close to zero]
behaviour of the inorganic nitrogen.
The A-(DON) values (Fig. 2d) are positive in
the upper layer (up to +7 p.mol-N·dm- 3 ), indicating a biological release of DON subsequent to the
phytoplankton activity, while they are dose to
zero in the deeper part of the water column indicating, also for DON, a conservative behaviour in
the bottom layer.
Dissolved Phosphorus in Late Winter
The distribution of DIP (Fig. 3a) does not show
the advection of phosphate due to the freshwater
input in the upper layer but, on the contrary. its
highest values of concentration are observed in
the deeper offshore zone (up to 0.05
JlIIlol-P·dm- 3 ). The DOP concentrations (Fig. 3b)
decrease from the inshore {0.07 p.mol-P·dm- 3 } to
the offshore (0.01 p.mol-P-dm- 3 ) zone, inversely
EF1
-1~~~~~~y~.~~:' ~~:::::::::::::::::::::J£-10~~~ c
'2.
•
a
b
-1n.J---g -2
~-3 Gl
0-4
-5
o
5
10
15
20
Distance (miles)
~-(DIN)
3
- - - 0
~-(DON)
~,--I,}---o <' ==>J" d
~
o
5
10
15
20
Distance (miles)
Fig_ 2. Concentrations and A-(i) values (jlmol-N-dm- 3 ) of dissolved inorganic and organic nitrogen (DIN and DON) in February 1997
(transect EF-A)
39
Results and Discussion
The following figures (Figs. 2, 5) show both distributions of concentration and 6-(i) balances
for each considered nutrient along the transects
of Fig. 1. Black lines, visible in the figures, indicate the position of the halo cline which separates, in both seasons, an upper layer, more influenced by the freshwater inputs (range of salinity
from 29.0 up to 35.0), from a bottom layer and/or
offshore zone (salinity higher than 35.0) less
influenced by continental inputs.
Dissolved Nitrogen in Late Winter
In this period. the distribution of the DIN concentrations (Fig. 2a) shows a decreasing trend
from the upper layer (18 JlIIlol-N·dm- 3 ) to the
bottom (I JlIIlol-N·dm- 3 ), inversely related to the
salinity, which indicates the conspicuous input of
inorganic nitrogen associated with the advected
Po River waters. The DON concentrations show
(Fig. 2b) a more homogeneous distribution than
the DIN fraction (from 6 up to 14 JLmol-N·dm- 3 )
which represents the most abundant pool of the
dissolved nitrogen.
In spite of the high DIN concentrations,
A-(DIN) (Fig. 2c) is negative in the upper layer
because of the biological uptake of this inorganic nutrient (values from -6 up to -18
pmol-N.dm- 3 ). On the contrary. the lower DIN
concentrations under the halocline are related to
a quasi-conservative [A-(DIN) close to zero]
behaviour of the inorganic nitrogen.
The A-(DON) values (Fig. 2d) are positive in
the upper layer (up to +7 p.mol-N·dm- 3 ), indicating a biological release of DON subsequent to the
phytoplankton activity, while they are dose to
zero in the deeper part of the water column indicating, also for DON, a conservative behaviour in
the bottom layer.
Dissolved Phosphorus in Late Winter
The distribution of DIP (Fig. 3a) does not show
the advection of phosphate due to the freshwater
input in the upper layer but, on the contrary. its
highest values of concentration are observed in
the deeper offshore zone (up to 0.05
JlIIlol-P·dm- 3 ). The DOP concentrations (Fig. 3b)
decrease from the inshore {0.07 p.mol-P·dm- 3 } to
the offshore (0.01 p.mol-P-dm- 3 ) zone, inversely
EF1
-1~~~~~~y~.~~:' ~~:::::::::::::::::::::J£-10~~~ c
'2.
•
a
b
-1n.J---g -2
~-3 Gl
0-4
-5
o
5
10
15
20
Distance (miles)
~-(DIN)
3
- - - 0
~-(DON)
~,--I,}---o <' ==>J" d
~
o
5
10
15
20
Distance (miles)
Fig_ 2. Concentrations and A-(i) values (jlmol-N-dm- 3 ) of dissolved inorganic and organic nitrogen (DIN and DON) in February 1997
(transect EF-A)