

34
V. Cardin and L. Ursella
a
57 56 55 54 53
52 51 50 49 4S 47 46
:"
~
:ry..
. ~.
i
. ~ .
. . .
.
.
:g
:\)
:
:
........
-+-- ~r l ~o
~
. ~ .
first group
D
I t .
:~:
:
~
. . .
. .
c..
second group
transect E
0 10 20 30 40 50 60 70 80 90 100
third group
distance (dbar)
b
57 56 55 54 53
52 51 50 49 48 47 46
first group
D
second group
transectE
o 10 20 30 40 50 60 70 80 90 100
distance (dbar)
third group
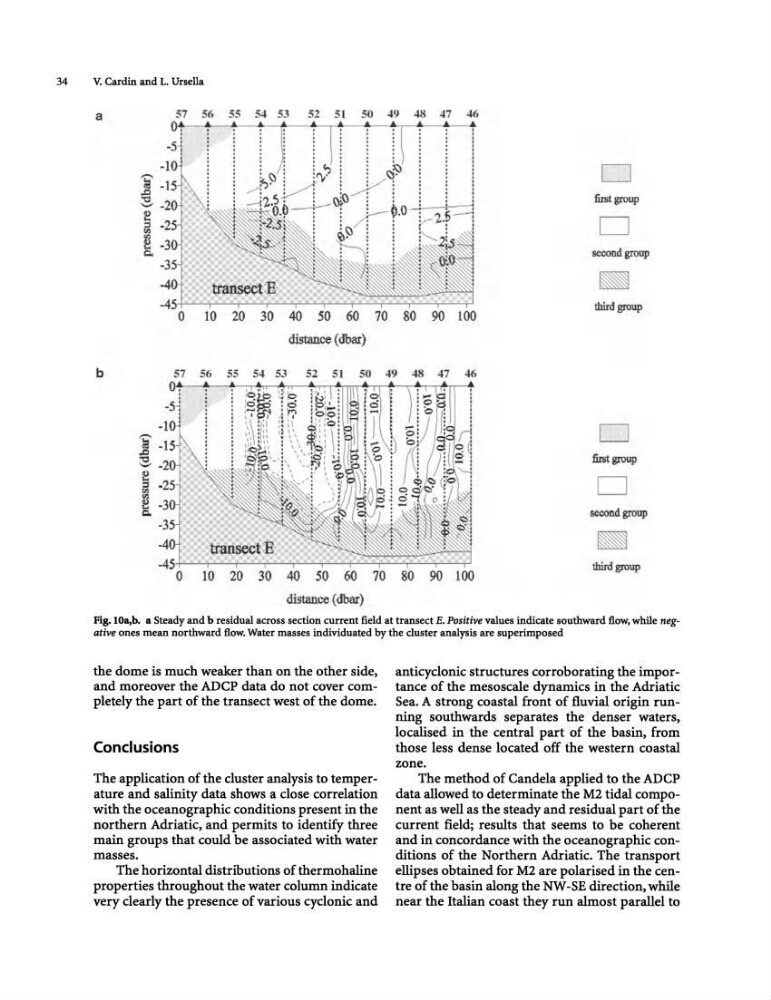
Fig.IOa,b. a Steady and b residual across section current field at transect E. Positive values indicate southward flow, while negative ones mean northward flow. Water masses individuated by the cluster analysis are superimposed
the dome is much weaker than on the other side,
and moreover the ADCP data do not cover completely the part of the transect west of the dome.
Conclusions
The application of the cluster analysis to temperature and salinity data shows a close correlation
with the oceanographic conditions present in the
northern Adriatic, and permits to identify three
main groups that could be associated with water
masses.
The horizontal distributions of thermohaline
properties throughout the water column indicate
very clearly the presence of various cyclonic and
anticyclonic structures corroborating the importance of the mesoscale dynamics in the Adriatic
Sea. A strong coastal front of fluvial origin running southwards separates the denser waters,
localised in the central part of the basin, from
those less dense located off the western coastal
zone.
The method of Candela applied to the ADCP
data allowed to determinate the M2 tidal component as well as the steady and residual part of the
current field; results that seems to be coherent
and in concordance with the oceanographic conditions of the Northern Adriatic. The transport
ellipses obtained for M2 are polarised in the centre of the basin along the NW-SE direction. while
near the Italian coast they run almost parallel to
V. Cardin and L. Ursella
a
57 56 55 54 53
52 51 50 49 4S 47 46
:"
~
:ry..
. ~.
i
. ~ .
. . .
.
.
:g
:\)
:
:
........
-+-- ~r l ~o
~
. ~ .
first group
D
I t .
:~:
:
~
. . .
. .
c..
second group
transect E
0 10 20 30 40 50 60 70 80 90 100
third group
distance (dbar)
b
57 56 55 54 53
52 51 50 49 48 47 46
first group
D
second group
transectE
o 10 20 30 40 50 60 70 80 90 100
distance (dbar)
third group
Fig.IOa,b. a Steady and b residual across section current field at transect E. Positive values indicate southward flow, while negative ones mean northward flow. Water masses individuated by the cluster analysis are superimposed
the dome is much weaker than on the other side,
and moreover the ADCP data do not cover completely the part of the transect west of the dome.
Conclusions
The application of the cluster analysis to temperature and salinity data shows a close correlation
with the oceanographic conditions present in the
northern Adriatic, and permits to identify three
main groups that could be associated with water
masses.
The horizontal distributions of thermohaline
properties throughout the water column indicate
very clearly the presence of various cyclonic and
anticyclonic structures corroborating the importance of the mesoscale dynamics in the Adriatic
Sea. A strong coastal front of fluvial origin running southwards separates the denser waters,
localised in the central part of the basin, from
those less dense located off the western coastal
zone.
The method of Candela applied to the ADCP
data allowed to determinate the M2 tidal component as well as the steady and residual part of the
current field; results that seems to be coherent
and in concordance with the oceanographic conditions of the Northern Adriatic. The transport
ellipses obtained for M2 are polarised in the centre of the basin along the NW-SE direction. while
near the Italian coast they run almost parallel to