

478
P. Del Negro et al.
45
44
..r:::
"5 43
Z
CD
"'C
:l
~ 42
....J
41
40
12
13
14
18
19
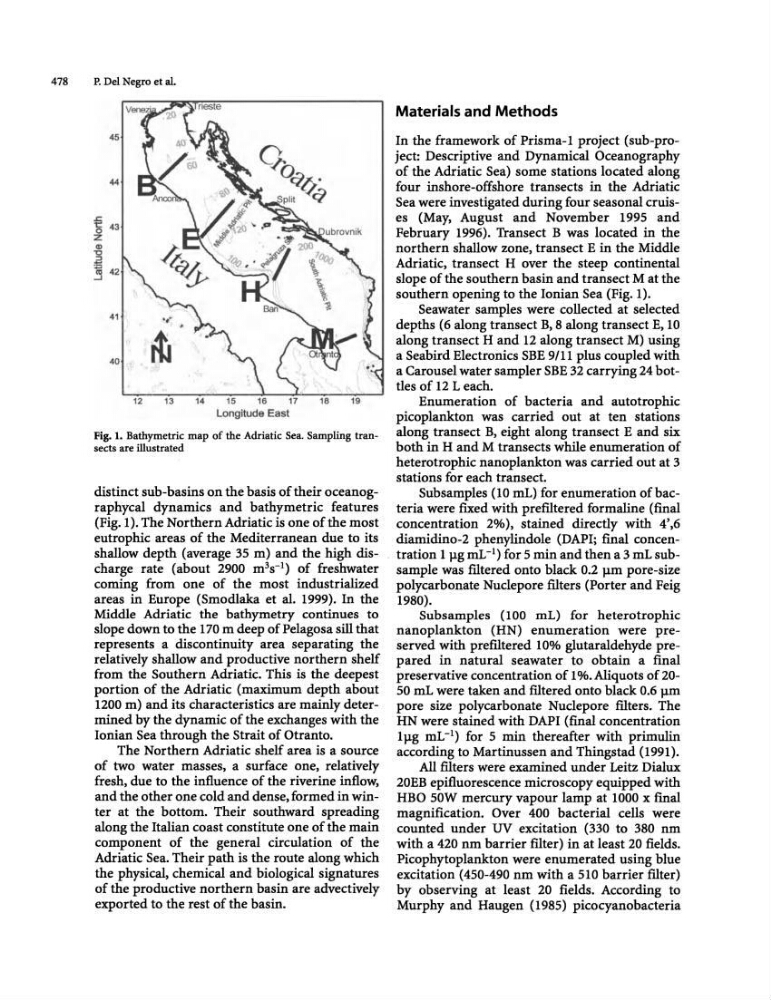
Fig. 1. Bathymetric map of the Adriatic Sea. Sampling transects are illustrated
distinct sub-basins on the basis of their oceanographycal dynamics and bathymetric features
(Fig. 1). The Northern Adriatic is one of the most
eutrophic areas of the Mediterranean due to its
shallow depth (average 35 m) and the high discharge rate (about 2900 m 3 s- 1 ) of freshwater
corning from one of the most industrialized
areas in Europe (Smodlaka et al. 1999). In the
Middle Adriatic the bathymetry continues to
slope down to the 170 m deep of Pelagosa sill that
represents a discontinuity area separating the
relatively shallow and productive northern shelf
from the Southern Adriatic. This is the deepest
portion of the Adriatic (maximum depth about
1200 m) and its characteristics are mainly determined by the dynamic of the exchanges with the
Ionian Sea through the Strait of Otranto.
The Northern Adriatic shelf area is a source
of two water masses, a surface one, relatively
fresh, due to the influence of the riverine inflow,
and the other one cold and dense, formed in winter at the bottom. Their southward spreading
along the Italian coast constitute one of the main
component of the general circulation of the
Adriatic Sea. Their path is the route along which
the physical, chemical and biological signatures
of the productive northern basin are advectively
exported to the rest of the basin.
Materials and Methods
In the framework of Prisma-l project (sub-project: Descriptive and Dynamical Oceanography
of the Adriatic Sea) some stations located along
four inshore-offshore transects in the Adriatic
Sea were investigated during four seasonal cruises (May, August and November 1995 and
February 1996). Transect B was located in the
northern shallow zone, transect E in the Middle
Adriatic, transect H over the steep continental
slope of the southern basin and transect M at the
southern opening to the Ionian Sea (Fig. 1).
Seawater samples were collected at selected
depths (6 along transect B, 8 along transect E, 10
along transect H and 12 along transect M) using
a Seabird Electronics SBE 9/11 plus coupled with
a Carousel water sampler SBE 32 carrying 24 bottles of 12 Leach.
Enumeration of bacteria and autotrophic
picoplankton was carried out at ten stations
along transect B, eight along transect E and six
both in H and M transects while enumeration of
heterotrophic nanoplankton was carried out at 3
stations for each transect.
Subsamples (10 roL) for enumeration of bacteria were flxed with preIDtered formaline (flnal
concentration 2%), stained directly with 4',6
diamidino-2 phenylindole (DAPI; flnal concen. tration 1 lIg mL -I) for 5 min and then a 3 mL subsample was mtered onto black 0.2 p.rn pore-size
polycarbonate Nudepore IDters (Porter and Feig
1980).
Subsamples (100 mL) for heterotrophic
nanoplankton (HN) enumeration were preserved with premtered 10% glutaraldehyde prepared in natural seawater to obtain a final
preservative concentration of 1 %. Aliquots of 2050 mL were taken and mtered onto black 0.6 lIm
pore size polycarbonate Nuclepore IDters. The
HN were stained with DAPI (flnal concentration
1 lIg mL-I) for 5 min thereafter with primulin
according to Martinussen and Thingstad (1991).
All mters were examined under Leitz Dialux
20EB epifluorescence microscopy equipped with
HBO SOW mercury vapour lamp at 1000 x final
magnification. Over 400 bacterial cells were
counted under UV excitation (330 to 380 nm
with a 420 nm barrier IDter) in at least 20 fields.
Picophytoplankton were enumerated using blue
excitation (4S0-490 nm with a 510 barrier IDter)
by observing at least 20 fields. According to
Murphy and Haugen (1985) picocyanobacteria
P. Del Negro et al.
45
44
..r:::
"5 43
Z
CD
"'C
:l
~ 42
....J
41
40
12
13
14
18
19
Fig. 1. Bathymetric map of the Adriatic Sea. Sampling transects are illustrated
distinct sub-basins on the basis of their oceanographycal dynamics and bathymetric features
(Fig. 1). The Northern Adriatic is one of the most
eutrophic areas of the Mediterranean due to its
shallow depth (average 35 m) and the high discharge rate (about 2900 m 3 s- 1 ) of freshwater
corning from one of the most industrialized
areas in Europe (Smodlaka et al. 1999). In the
Middle Adriatic the bathymetry continues to
slope down to the 170 m deep of Pelagosa sill that
represents a discontinuity area separating the
relatively shallow and productive northern shelf
from the Southern Adriatic. This is the deepest
portion of the Adriatic (maximum depth about
1200 m) and its characteristics are mainly determined by the dynamic of the exchanges with the
Ionian Sea through the Strait of Otranto.
The Northern Adriatic shelf area is a source
of two water masses, a surface one, relatively
fresh, due to the influence of the riverine inflow,
and the other one cold and dense, formed in winter at the bottom. Their southward spreading
along the Italian coast constitute one of the main
component of the general circulation of the
Adriatic Sea. Their path is the route along which
the physical, chemical and biological signatures
of the productive northern basin are advectively
exported to the rest of the basin.
Materials and Methods
In the framework of Prisma-l project (sub-project: Descriptive and Dynamical Oceanography
of the Adriatic Sea) some stations located along
four inshore-offshore transects in the Adriatic
Sea were investigated during four seasonal cruises (May, August and November 1995 and
February 1996). Transect B was located in the
northern shallow zone, transect E in the Middle
Adriatic, transect H over the steep continental
slope of the southern basin and transect M at the
southern opening to the Ionian Sea (Fig. 1).
Seawater samples were collected at selected
depths (6 along transect B, 8 along transect E, 10
along transect H and 12 along transect M) using
a Seabird Electronics SBE 9/11 plus coupled with
a Carousel water sampler SBE 32 carrying 24 bottles of 12 Leach.
Enumeration of bacteria and autotrophic
picoplankton was carried out at ten stations
along transect B, eight along transect E and six
both in H and M transects while enumeration of
heterotrophic nanoplankton was carried out at 3
stations for each transect.
Subsamples (10 roL) for enumeration of bacteria were flxed with preIDtered formaline (flnal
concentration 2%), stained directly with 4',6
diamidino-2 phenylindole (DAPI; flnal concen. tration 1 lIg mL -I) for 5 min and then a 3 mL subsample was mtered onto black 0.2 p.rn pore-size
polycarbonate Nudepore IDters (Porter and Feig
1980).
Subsamples (100 mL) for heterotrophic
nanoplankton (HN) enumeration were preserved with premtered 10% glutaraldehyde prepared in natural seawater to obtain a final
preservative concentration of 1 %. Aliquots of 2050 mL were taken and mtered onto black 0.6 lIm
pore size polycarbonate Nuclepore IDters. The
HN were stained with DAPI (flnal concentration
1 lIg mL-I) for 5 min thereafter with primulin
according to Martinussen and Thingstad (1991).
All mters were examined under Leitz Dialux
20EB epifluorescence microscopy equipped with
HBO SOW mercury vapour lamp at 1000 x final
magnification. Over 400 bacterial cells were
counted under UV excitation (330 to 380 nm
with a 420 nm barrier IDter) in at least 20 fields.
Picophytoplankton were enumerated using blue
excitation (4S0-490 nm with a 510 barrier IDter)
by observing at least 20 fields. According to
Murphy and Haugen (1985) picocyanobacteria