

28
V. Cardin and 1. Ursella
area, a central zone of higher density and salinity due to the cyclonic nature of the basin-scale
Adriatic general circulation is observed.
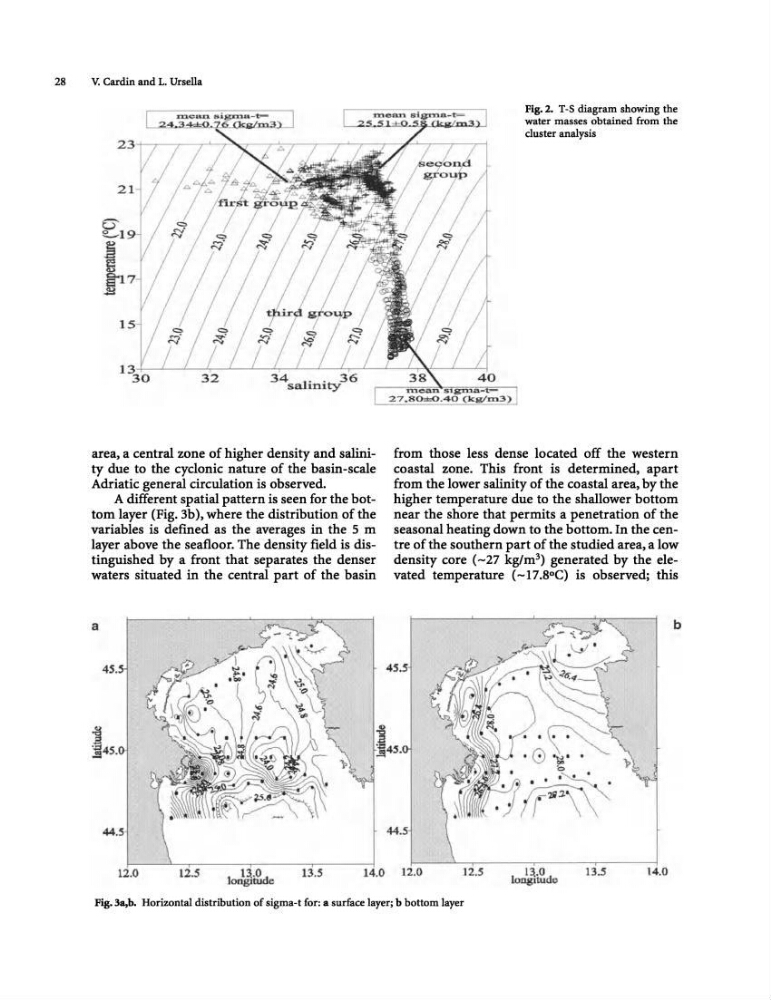
A different spatial pattern is seen for the bottom layer (Fig. 3b), where the distribution of the
variables is defined as the averages in the 5 m
layer above the seafloor. The density field is distinguished by a front that separates the denser
waters situated in the central part of the basin
a
45.
]
~45.
12.0
Fig.2. T-S diagram showing the
water masses obtained from the
duster analysis
from those less dense located off the western
coastal zone. This front is determined, apart
from the lower salinity of the coastal area, by the
higher temperature due to the shallower bottom
near the shore that permits a penetration of the
seasonal heating down to the bottom. In the centre of the southern part of the studied area, a low
density core (-27 kglm 3 ) generated by the elevated temperature (-17.8°C) is observed; this
45.5
44.5
12.0
]2.5
10 l~.Od
Dgltue
13.5
b
14.0
Fig.3a,b. Horizontal distribution of sigma-t for: a surface layer; b bottom layer
V. Cardin and 1. Ursella
area, a central zone of higher density and salinity due to the cyclonic nature of the basin-scale
Adriatic general circulation is observed.
A different spatial pattern is seen for the bottom layer (Fig. 3b), where the distribution of the
variables is defined as the averages in the 5 m
layer above the seafloor. The density field is distinguished by a front that separates the denser
waters situated in the central part of the basin
a
45.
]
~45.
12.0
Fig.2. T-S diagram showing the
water masses obtained from the
duster analysis
from those less dense located off the western
coastal zone. This front is determined, apart
from the lower salinity of the coastal area, by the
higher temperature due to the shallower bottom
near the shore that permits a penetration of the
seasonal heating down to the bottom. In the centre of the southern part of the studied area, a low
density core (-27 kglm 3 ) generated by the elevated temperature (-17.8°C) is observed; this
45.5
44.5
12.0
]2.5
10 l~.Od
Dgltue
13.5
b
14.0
Fig.3a,b. Horizontal distribution of sigma-t for: a surface layer; b bottom layer