

440
M. Fabiano et al.
the southern area (mean value between stations
8 and 10, 318 Ilg P). Particulate carbohydrate
concentrations ranged from undetectable to 503
Ilg 1-1. Carbohydrate concentrations fluctuated
widely and displayed significant seasonal changes (Fig. 6c). No significant spatial changes were
observed (Fig. 6d), although concentrations
decreased from station 1 to station 4 (annual average 104 Ilg }-1 and 41 Ilg 1-1 respectively), then
increased up to station 10 (91 J.1g }-l). Particulate
lipid concentrations (annual average 184 J.1g J-l)
ranged from 7 to 1441 J.1g P. Particulate lipids did
not display significant spatial changes, while
significant seasonal changes were observed (Fig.
6e,f). A significant peak occurred in July (270 Ilg
1-1). Particulate proteins were the most abundant
biochemical compound, accounting for an
annual average of approximately 66% ofbiopolymerk carbon, followed by lipids (23.0%) and
carbohydrates (11.0%). Biopolymeric organic
carbon concentrations (data not shown; annual
average, 355 J.1g C 1-1) ranged from 100 J.1g C J-1 to
13811lg C 1-1. P-BPC concentrations did not show
significant spatial changes, while significant seasonal changes were observed, with maximum
values in February, July and November (average
446,535 and 339.1 J.1gC I-I, respectively).
Biochemical Composition of Sediment
Organic Matter
Sedimentary chlorophyll-a concentrations in the
study area were, on annual average, 3.1 J.1g g-l.
ANOVA results did not show any significant seasonal or spatial changes. However, SeptemberOctober and February-March appeared to be the
accumulation periods (Fig. 7). Highest concen12,--------------------------------,
'; 10
CII
CII 8
;:I..
, 6
:E 4
~ 2
o
1 2 3 4 5 6 7 8 9 10 11 12
Month
Fig. 7. Temporal changes in chIorophyll-a concentrations in
the sediments of the Marsala lagoon. Error bars indicate standard deviations among stations
Station A
60
20
50
~
15 i:n
40
(.)
i:n 30
10 rn
rn
.s
E 20
5 (.)
10
0...
m
0
0 ch
J Jul A
S
0
N
0
J
F
M A
M
Station B
100
40
~
75
30 c"
~ c"
(.)
50
20
rn
Dl
.s
E
u
25
10 c..
m
0
0 ch
J Jul A S 0
N 0 J F M A M
Station C
50
30 :40
i:n
20 U
~c" 30
CI
~ 20
.s
10 u
10
Q.
m
0
0 ch
J J u l A 5 0
N
0
J
F
M
A M
Station D
60
20 :50
i:n
i:n 40
15 (.)
~ 30
CI
10
.s
20
u
5 Q.
10
m
0
0 ch
J Jul A
5
a N D
J
F
M
A
M
Month
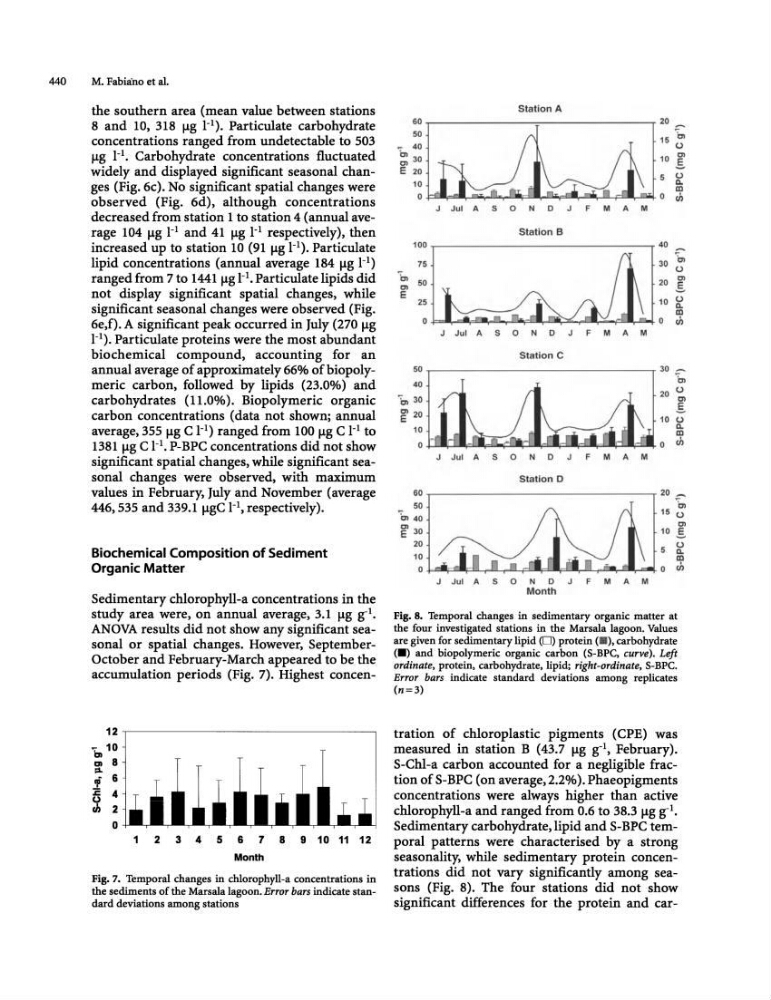
Fig. 8. Temporal changes in sedimentary organic matter at
the four investigated stations in the Marsala lagoon. Values
are given for sedimentary lipid (0) protein (II), carbohydrate
(.) and biopolymeric organic carbon (S-BPC, curve). Left
ordinate, protein, carbohydrate, lipid; right-ordinate, S-BPC.
Error bars indicate standard deviations among replicates
(n=3)
tration of chloroplastic pigments (CPE) was
measured in station B (43.7 J.1g g-l, February).
S-Chl-a carbon accounted for a negligible fraction of S-BPC (on average, 2.2%). Phaeopigments
concentrations were always higher than active
chlorophyll-a and ranged from 0.6 to 38.3 J.1g g-l,
Sedimentary carbohydrate, lipid and S-BPC temporal patterns were characterised by a strong
seasonality, while sedimentary protein concentrations did not vary significantly among seasons (Fig. 8). The four stations did not show
significant differences for the protein and car-
M. Fabiano et al.
the southern area (mean value between stations
8 and 10, 318 Ilg P). Particulate carbohydrate
concentrations ranged from undetectable to 503
Ilg 1-1. Carbohydrate concentrations fluctuated
widely and displayed significant seasonal changes (Fig. 6c). No significant spatial changes were
observed (Fig. 6d), although concentrations
decreased from station 1 to station 4 (annual average 104 Ilg }-1 and 41 Ilg 1-1 respectively), then
increased up to station 10 (91 J.1g }-l). Particulate
lipid concentrations (annual average 184 J.1g J-l)
ranged from 7 to 1441 J.1g P. Particulate lipids did
not display significant spatial changes, while
significant seasonal changes were observed (Fig.
6e,f). A significant peak occurred in July (270 Ilg
1-1). Particulate proteins were the most abundant
biochemical compound, accounting for an
annual average of approximately 66% ofbiopolymerk carbon, followed by lipids (23.0%) and
carbohydrates (11.0%). Biopolymeric organic
carbon concentrations (data not shown; annual
average, 355 J.1g C 1-1) ranged from 100 J.1g C J-1 to
13811lg C 1-1. P-BPC concentrations did not show
significant spatial changes, while significant seasonal changes were observed, with maximum
values in February, July and November (average
446,535 and 339.1 J.1gC I-I, respectively).
Biochemical Composition of Sediment
Organic Matter
Sedimentary chlorophyll-a concentrations in the
study area were, on annual average, 3.1 J.1g g-l.
ANOVA results did not show any significant seasonal or spatial changes. However, SeptemberOctober and February-March appeared to be the
accumulation periods (Fig. 7). Highest concen12,--------------------------------,
'; 10
CII
CII 8
;:I..
, 6
:E 4
~ 2
o
1 2 3 4 5 6 7 8 9 10 11 12
Month
Fig. 7. Temporal changes in chIorophyll-a concentrations in
the sediments of the Marsala lagoon. Error bars indicate standard deviations among stations
Station A
60
20
50
~
15 i:n
40
(.)
i:n 30
10 rn
rn
.s
E 20
5 (.)
10
0...
m
0
0 ch
J Jul A
S
0
N
0
J
F
M A
M
Station B
100
40
~
75
30 c"
~ c"
(.)
50
20
rn
Dl
.s
E
u
25
10 c..
m
0
0 ch
J Jul A S 0
N 0 J F M A M
Station C
50
30 :40
i:n
20 U
~c" 30
CI
~ 20
.s
10 u
10
Q.
m
0
0 ch
J J u l A 5 0
N
0
J
F
M
A M
Station D
60
20 :50
i:n
i:n 40
15 (.)
~ 30
CI
10
.s
20
u
5 Q.
10
m
0
0 ch
J Jul A
5
a N D
J
F
M
A
M
Month
Fig. 8. Temporal changes in sedimentary organic matter at
the four investigated stations in the Marsala lagoon. Values
are given for sedimentary lipid (0) protein (II), carbohydrate
(.) and biopolymeric organic carbon (S-BPC, curve). Left
ordinate, protein, carbohydrate, lipid; right-ordinate, S-BPC.
Error bars indicate standard deviations among replicates
(n=3)
tration of chloroplastic pigments (CPE) was
measured in station B (43.7 J.1g g-l, February).
S-Chl-a carbon accounted for a negligible fraction of S-BPC (on average, 2.2%). Phaeopigments
concentrations were always higher than active
chlorophyll-a and ranged from 0.6 to 38.3 J.1g g-l,
Sedimentary carbohydrate, lipid and S-BPC temporal patterns were characterised by a strong
seasonality, while sedimentary protein concentrations did not vary significantly among seasons (Fig. 8). The four stations did not show
significant differences for the protein and car-