

438
M. Fabiano et al.
a 3 0 . 0 , - - - - - - - - - - - - - - - - - - - - ,
P 25.0
e 200
::I
•
i! 15.0
~ 10.0
~ 5.0
0.0 +--,-----,---.--,--r-----.----.-r-----,---.-,-------j
b 44.0 I
42.01
i 40.0-1
a.
\
~38.0 -:
'c; 36.0-l
1 2 3 4 5 6 7 8 9 10 11 12
Month
m 34.0 j
32.0 _
30.0 +--,-----,---,---,--r-----,---.-.------.
1 2 3 4 5 6 7 8 9 10 11 12
Month
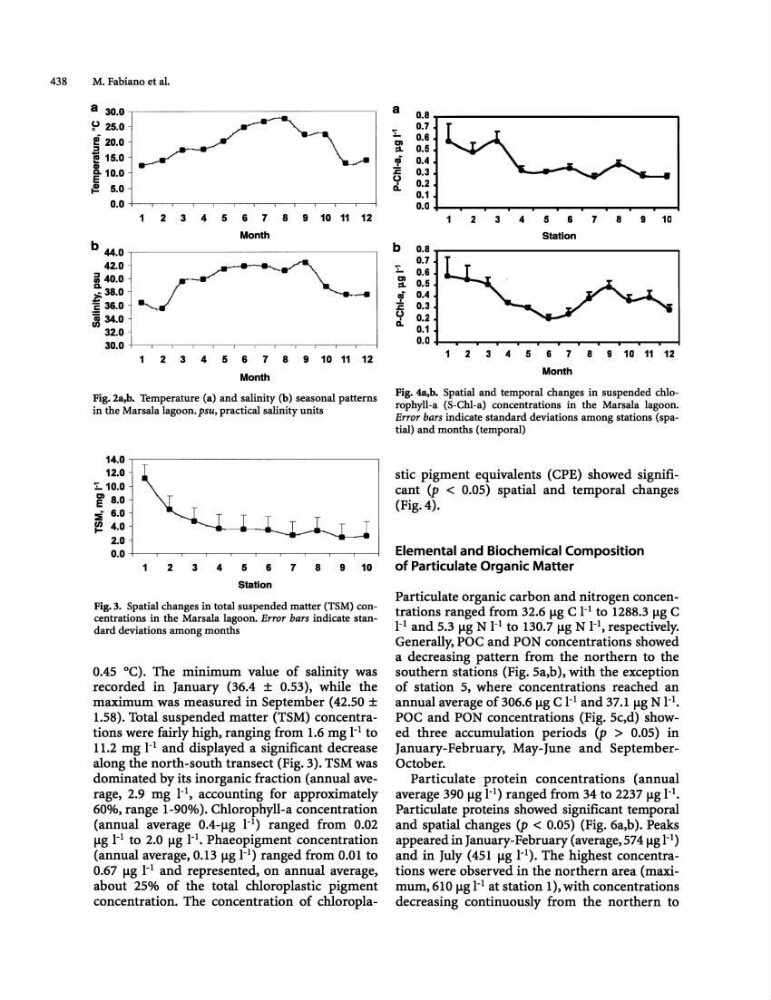
Fig.2a,b. Temperature (a) and salinity (b) seasonal patterns
in the Marsala lagoon. psu, practical salinity units
14.0
12.0
L10.0
~ 8.0
:i 6.0
~ 4.0
2.0
0.0
1
2
3
4
5
6
7
8
9
10
Station
Fig. 3. Spatial changes in total suspended matter (TSM) concentrations in the Marsala lagoon. Error bars indicate standard deviations among months
0.45 °C). The minimum value of salinity was
recorded in January (36.4 ± 0.53), while the
maximum was measured in September (42.50 ±
1.58). Total suspended matter (TSM) concentrations were fairly high, ranging from 1.6 mg J-1 to
11.2 mg I-1 and displayed a significant decrease
along the north-south transect (Fig. 3). TSM was
dominated by its inorganic fraction (annual average, 2.9 mg 1- 1 , accounting for approximately
60%, range 1-90%). Chlorophyll-a concentration
(annual average O.4-jlg t 1 ) ranged from 0.02
jlg 1- 1 to 2.0 jlg 1-1. Phaeopigment concentration
(annual average, 0.13 jlg J-l) ranged from 0.01 to
0.67 jlg P and represented. on annual average,
about 25% of the total chloroplastic pigment
concentration. The concentration of chloroplaa
L
01
::s,
:c
~
b
L
01
::s,
:c 0
d..
0.8
0.7
0.6
0.5
0.4
0.3
0.2
0.1
0.0
0.8
0.7
0.6
0.5
0.4
0.3
0.2
0.1
0.0
1
2
3
4
5
6
7
8
9
10
Station
1 2 3 4 5 6 7 8 9 10 11 12
Month
Fig. 4a,b. Spatial and temporal changes in suspended chlorophyll-a (S-ChI-a) concentrations in the Marsala lagoon.
Error bars indicate standard deviations among stations (spatial) and months (temporal)
stic pigment equivalents (CPE) showed significant (p < 0.05) spatial and temporal changes
(Fig. 4).
Elemental and Biochemical Composition
of Particulate Organic Matter
Particulate organic carbon and nitrogen concentrations ranged from 32.6 jlg C 1-1 to 1288.3 jlg e
I-l and 5.3 .... g N I-1 to 130.7 jlg N 1- 1 , respectively.
Generally, poe and PON concentrations showed
a decreasing pattern from the northern to the
southern stations (Fig. 5a.b), with the exception
of station 5, where concentrations reached an
annual average of 306.6 jlg C J-1 and 37.1 jlg N 1-1.
poe and PON concentrations (Fig. 5c,d) showed three accumulation periods (p > 0.05) in
January-February, May-June and SeptemberOctober.
Particulate protein concentrations (annual
average 390 jlg 1-1) ranged from 34 to 2237 jlg P.
Particulate proteins showed significant temporal
and spatial changes (p < 0.05) (Fig. 6a,b). Peaks
appeared in January-February (average, 574 jlg 1- 1 )
and in July (451 jlg 1-1). The highest concentrations were observed in the northern area (maximum, 610 jlg 1- 1 at station 1), with concentrations
decreasing continuously from the northern to
M. Fabiano et al.
a 3 0 . 0 , - - - - - - - - - - - - - - - - - - - - ,
P 25.0
e 200
::I
•
i! 15.0
~ 10.0
~ 5.0
0.0 +--,-----,---.--,--r-----.----.-r-----,---.-,-------j
b 44.0 I
42.01
i 40.0-1
a.
\
~38.0 -:
'c; 36.0-l
1 2 3 4 5 6 7 8 9 10 11 12
Month
m 34.0 j
32.0 _
30.0 +--,-----,---,---,--r-----,---.-.------.
1 2 3 4 5 6 7 8 9 10 11 12
Month
Fig.2a,b. Temperature (a) and salinity (b) seasonal patterns
in the Marsala lagoon. psu, practical salinity units
14.0
12.0
L10.0
~ 8.0
:i 6.0
~ 4.0
2.0
0.0
1
2
3
4
5
6
7
8
9
10
Station
Fig. 3. Spatial changes in total suspended matter (TSM) concentrations in the Marsala lagoon. Error bars indicate standard deviations among months
0.45 °C). The minimum value of salinity was
recorded in January (36.4 ± 0.53), while the
maximum was measured in September (42.50 ±
1.58). Total suspended matter (TSM) concentrations were fairly high, ranging from 1.6 mg J-1 to
11.2 mg I-1 and displayed a significant decrease
along the north-south transect (Fig. 3). TSM was
dominated by its inorganic fraction (annual average, 2.9 mg 1- 1 , accounting for approximately
60%, range 1-90%). Chlorophyll-a concentration
(annual average O.4-jlg t 1 ) ranged from 0.02
jlg 1- 1 to 2.0 jlg 1-1. Phaeopigment concentration
(annual average, 0.13 jlg J-l) ranged from 0.01 to
0.67 jlg P and represented. on annual average,
about 25% of the total chloroplastic pigment
concentration. The concentration of chloroplaa
L
01
::s,
:c
~
b
L
01
::s,
:c 0
d..
0.8
0.7
0.6
0.5
0.4
0.3
0.2
0.1
0.0
0.8
0.7
0.6
0.5
0.4
0.3
0.2
0.1
0.0
1
2
3
4
5
6
7
8
9
10
Station
1 2 3 4 5 6 7 8 9 10 11 12
Month
Fig. 4a,b. Spatial and temporal changes in suspended chlorophyll-a (S-ChI-a) concentrations in the Marsala lagoon.
Error bars indicate standard deviations among stations (spatial) and months (temporal)
stic pigment equivalents (CPE) showed significant (p < 0.05) spatial and temporal changes
(Fig. 4).
Elemental and Biochemical Composition
of Particulate Organic Matter
Particulate organic carbon and nitrogen concentrations ranged from 32.6 jlg C 1-1 to 1288.3 jlg e
I-l and 5.3 .... g N I-1 to 130.7 jlg N 1- 1 , respectively.
Generally, poe and PON concentrations showed
a decreasing pattern from the northern to the
southern stations (Fig. 5a.b), with the exception
of station 5, where concentrations reached an
annual average of 306.6 jlg C J-1 and 37.1 jlg N 1-1.
poe and PON concentrations (Fig. 5c,d) showed three accumulation periods (p > 0.05) in
January-February, May-June and SeptemberOctober.
Particulate protein concentrations (annual
average 390 jlg 1-1) ranged from 34 to 2237 jlg P.
Particulate proteins showed significant temporal
and spatial changes (p < 0.05) (Fig. 6a,b). Peaks
appeared in January-February (average, 574 jlg 1- 1 )
and in July (451 jlg 1-1). The highest concentrations were observed in the northern area (maximum, 610 jlg 1- 1 at station 1), with concentrations
decreasing continuously from the northern to