

26
V. Cardin and L. Ursella
winter, the water column is homogeneous, and
the fresh water remains in the coastal zone, being
separated from the off-shore waters by a frontal
system which runs parallel to the coast (Franco
1989) associated with a southward surface flux.
Furthermore, the Northern Adriatic has been
recognised as a site of convection and water
mass formation on the continental shelf
(Malanotte-Rizzoli 1991). Strong surface cooling
and evaporation due to the outbreaks of cold dry
air coming mainly from the north-east (Bora
wind) are responsible for the generation of dense
water whose density varies between 29.4 kg/m3
and 29.8 kg/m3 (Artegiani and Salusti 1987).
Data and Methods
Temperature and conductivity were measured
using a high resolution CTD during late summer
and autumn in the northern Adriatic as part of
the autumn campaign within the framework of
the PRISMA 2 Project. The campaign was carried
out from September 24 untill November 6 1997,
45.5
..g45 .
. ~
~
......
44.5
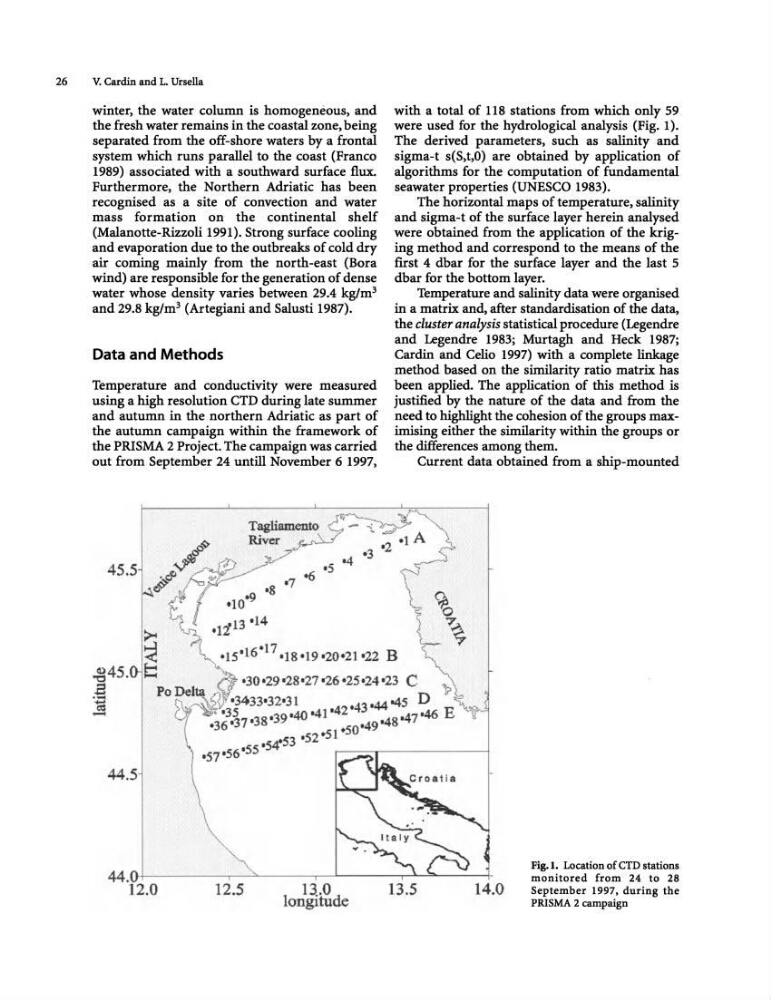
with a total of 118 stations from which only 59
were used for the hydrological analysis (Fig. 1).
The derived parameters, such as salinity and
sigma-t s(S,t,O) are obtained by application of
algorithms for the computation of fundamental
seawater properties (UNESCO 1983).
The horizontal maps of temperature, salinity
and sigma-t of the surface layer herein analysed
were obtained from the application of the kriging method and correspond to the means of the
first 4 dbar for the surface layer and the last 5
dbar for the bottom layer.
Temperature and salinity data were organised
in a matrix and, after standardisation of the data,
the cluster analysis statistical procedure (Legendre
and Legendre 1983; Murtagh and Heck 1987;
Cardin and Celio 1997) with a complete linkage
method based on the similarity ratio matrix has
been applied. The application of this method is
justified by the nature of the data and from the
need to highlight the cohesion of the groups maximising either the similarity within the groups or
the differences among them.
Current data obtained from a ship-mounted
44. H-------~~~----~~----~~----~·
Fig.I. Location of CTD stations
monitored from 24 to 28
September 1997, during the
PRISMA 2 campaign
12.0
12.5
13 .. 0
longitude
13.5
14.0
V. Cardin and L. Ursella
winter, the water column is homogeneous, and
the fresh water remains in the coastal zone, being
separated from the off-shore waters by a frontal
system which runs parallel to the coast (Franco
1989) associated with a southward surface flux.
Furthermore, the Northern Adriatic has been
recognised as a site of convection and water
mass formation on the continental shelf
(Malanotte-Rizzoli 1991). Strong surface cooling
and evaporation due to the outbreaks of cold dry
air coming mainly from the north-east (Bora
wind) are responsible for the generation of dense
water whose density varies between 29.4 kg/m3
and 29.8 kg/m3 (Artegiani and Salusti 1987).
Data and Methods
Temperature and conductivity were measured
using a high resolution CTD during late summer
and autumn in the northern Adriatic as part of
the autumn campaign within the framework of
the PRISMA 2 Project. The campaign was carried
out from September 24 untill November 6 1997,
45.5
..g45 .
. ~
~
......
44.5
with a total of 118 stations from which only 59
were used for the hydrological analysis (Fig. 1).
The derived parameters, such as salinity and
sigma-t s(S,t,O) are obtained by application of
algorithms for the computation of fundamental
seawater properties (UNESCO 1983).
The horizontal maps of temperature, salinity
and sigma-t of the surface layer herein analysed
were obtained from the application of the kriging method and correspond to the means of the
first 4 dbar for the surface layer and the last 5
dbar for the bottom layer.
Temperature and salinity data were organised
in a matrix and, after standardisation of the data,
the cluster analysis statistical procedure (Legendre
and Legendre 1983; Murtagh and Heck 1987;
Cardin and Celio 1997) with a complete linkage
method based on the similarity ratio matrix has
been applied. The application of this method is
justified by the nature of the data and from the
need to highlight the cohesion of the groups maximising either the similarity within the groups or
the differences among them.
Current data obtained from a ship-mounted
44. H-------~~~----~~----~~----~·
Fig.I. Location of CTD stations
monitored from 24 to 28
September 1997, during the
PRISMA 2 campaign
12.0
12.5
13 .. 0
longitude
13.5
14.0