

Macrobenthic specimens were counted and
identified at species level. Biomass values of different phyla were assessed in terms of wet weight
(gWW).
The following Cabioch index (Cabioch et al.
1980) was applied:
Ci = (q-p) I (q+p)
where: p = frequency of species i in 1981 data
set
q = frequency of species i in 1996 data
set
The Cabioch index ranges between -1
(species disappearance) and + 1 (species appearance).
Margalef species richness (Margalef 1958),
Shannon-Weaver diversity (Shannon and Weaver
1963) and Pielou evenness (Pielou 1966) indexes
were evaluated.
Table 1. Total density. biomass and species numbers in 1981
and 1996 samplings
Total macrobenthic density (ind./m 2 )
Total macrobenthic biomass (gWW/m2)
Species number:
Polychaetes
Crustaceans
Molluscs
Echinoderms
Other taxa
Total
others
molluscs 6%
cmslaceans
18%
1981
1996
126.4
101.6
6.6
6.3
46
38
16
22
7
8
6
1
6
6
81
75
polychaetes
51%
Variability in a Bathyal Community
341
Classification (duster analysis) and ordination (MDS) of data were performed on square
roottransformed density data (1981 + 1996 data),
grouping stations according to bathymetric levels
(400-500 m, 500-600 m and > 600 m), using the
Bray-Curtis similarity index (Bray-Curtis 1957).
The contribution of species to groups dissimilarity was assessed through R-mode analysis.
Classification, ordination and R-mode analysis
were performed using the software PRIMER of
the Plymouth Marine Laboratory.
Results
The comparison between present and past data
sets has evidenced large discrepancies according
to the different community descriptor parameters considered.
In fact, the macrobenthic community living
off the Portofino Promontory in the last 15 years
did not show any relevant variation in terms of
density, biomass as well as total species number
(Table 1; t-test, P>S %).
Quite similar values of Margalef species richness, Shannon-Weaver diversity and Pielou evenness were also found comparing 1981 and 1996
data: 3.42 versus 3.46, 1.90 versus 2.07 and 0.98
versus 0.96, respectively.
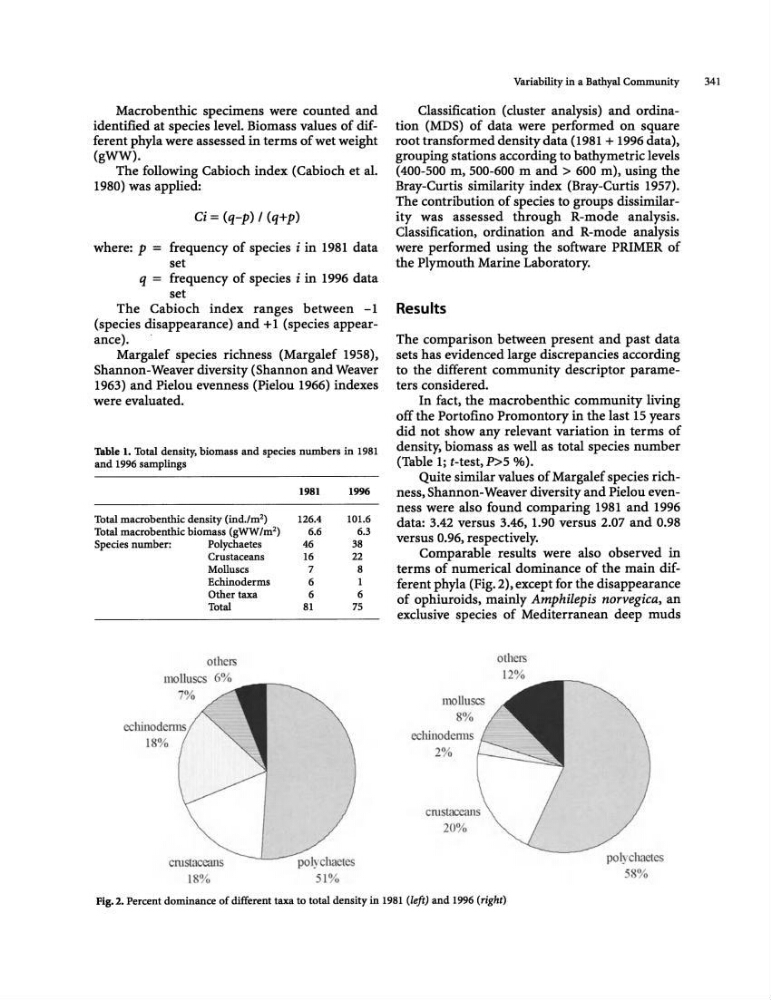
Comparable results were also observed in
terms of numerical dominance of the main different phyla (Fig. 2), except for the disappearance
of ophiuroids, mainly Amphilepis norvegica, an
exclusive species of Mediterranean deep muds
molluscs
8%
echinodenns
2%
cmstaceans
20%
otllers
12%
polychaet s
-8%
Fig. 2. Percent dominance of different taxa to total density in 1981 (left) and 1996 (right)
identified at species level. Biomass values of different phyla were assessed in terms of wet weight
(gWW).
The following Cabioch index (Cabioch et al.
1980) was applied:
Ci = (q-p) I (q+p)
where: p = frequency of species i in 1981 data
set
q = frequency of species i in 1996 data
set
The Cabioch index ranges between -1
(species disappearance) and + 1 (species appearance).
Margalef species richness (Margalef 1958),
Shannon-Weaver diversity (Shannon and Weaver
1963) and Pielou evenness (Pielou 1966) indexes
were evaluated.
Table 1. Total density. biomass and species numbers in 1981
and 1996 samplings
Total macrobenthic density (ind./m 2 )
Total macrobenthic biomass (gWW/m2)
Species number:
Polychaetes
Crustaceans
Molluscs
Echinoderms
Other taxa
Total
others
molluscs 6%
cmslaceans
18%
1981
1996
126.4
101.6
6.6
6.3
46
38
16
22
7
8
6
1
6
6
81
75
polychaetes
51%
Variability in a Bathyal Community
341
Classification (duster analysis) and ordination (MDS) of data were performed on square
roottransformed density data (1981 + 1996 data),
grouping stations according to bathymetric levels
(400-500 m, 500-600 m and > 600 m), using the
Bray-Curtis similarity index (Bray-Curtis 1957).
The contribution of species to groups dissimilarity was assessed through R-mode analysis.
Classification, ordination and R-mode analysis
were performed using the software PRIMER of
the Plymouth Marine Laboratory.
Results
The comparison between present and past data
sets has evidenced large discrepancies according
to the different community descriptor parameters considered.
In fact, the macrobenthic community living
off the Portofino Promontory in the last 15 years
did not show any relevant variation in terms of
density, biomass as well as total species number
(Table 1; t-test, P>S %).
Quite similar values of Margalef species richness, Shannon-Weaver diversity and Pielou evenness were also found comparing 1981 and 1996
data: 3.42 versus 3.46, 1.90 versus 2.07 and 0.98
versus 0.96, respectively.
Comparable results were also observed in
terms of numerical dominance of the main different phyla (Fig. 2), except for the disappearance
of ophiuroids, mainly Amphilepis norvegica, an
exclusive species of Mediterranean deep muds
molluscs
8%
echinodenns
2%
cmstaceans
20%
otllers
12%
polychaet s
-8%
Fig. 2. Percent dominance of different taxa to total density in 1981 (left) and 1996 (right)