

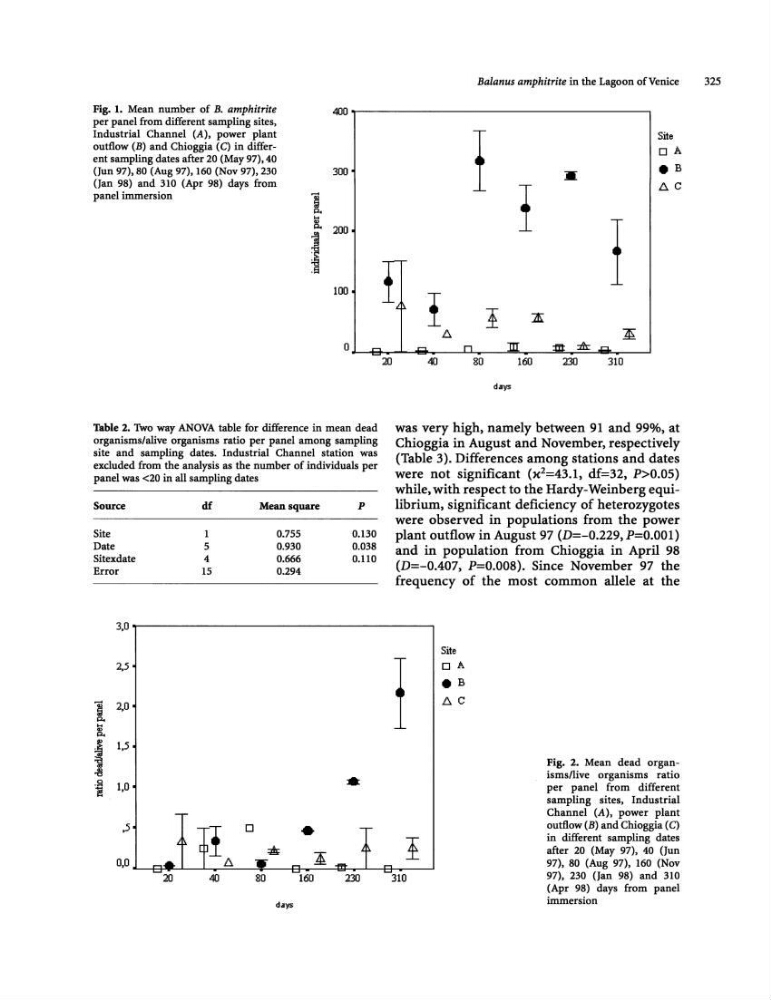
Fig. 1. Mean number of B. amphitrite
per panel from different sampling sites,
Industrial Channel (A), power plant
outflow (B) and Chioggia (C) in different sampling dates after 20 (May 97), 40
(Jun 97),80 (Aug 97), 160 (Nov 97).230
(Jan 98) and :no (Apr 98) days from
panel immersion
1 p..
.... ., p..
~
400
300
200
-r4~
100
I
_L...i.
Balanus amphitrite in the Lagoon of Venice
I
Site
OA.
e B
!
I::l.C
I
I ::as:
b.
]£:
0
~
.=.
n
:m:
:m: ::lh: .c.
Table 2. '!Wo way ANOVA table for difference in mean dead
organisms/alive organisms ratio per panel among sampling
site and sampling dates. Industrial Channel station was
excluded from the analysis as the number of individuals per
panel was <20 in all sampling dates
Source
df
Mean square
P
Site
1
0.755
0.130
Date
5
0.930
0.038
Sitexdate
40.666
0.110
Error
15
0.294
3,0
2,5 •
1
2,0
p..
....
., p..
~
1,5
~
~
. ~
1,0
•
-a
-
,5
i.~ ~]I
0
•
-~ ~ :I:_
l
0,0
~.
I::l.
..
20
40
80
160
230
days
20
~
40
80
160
230
310
days
was very high, namely between 91 and 99%, at
Chioggia in August and November, respectively
(Table 3). Differences among stations and dates
were not significant (x 2 =43.1, df=32, P>O.05)
while, with respect to the Hardy-Weinberg equilibrium, significant deficiency of heterozygotes
were observed in populations from the power
plant outflow in August 97 (D=-O.229, P=O.OOl)
and in population from Chioggia in April 98
(D=-0.407, P=O.008). Since November 97 the
frequency of the most common allele at the
Site
I
oA.
e B
b.C
!
310
Fig. 2. Mean dead organisms/live organisms ratio
per panel from different
sampling sites, Industrial
Channel (A), power plant
outflow (B) and Chioggia (C)
in different sampling dates
after 20 (May 97), 40 (Jun
97), 80 (Aug 97), 160 (Nov
97), 230 (Jan 98) and 310
(Apr 98) days from panel
immersion
325
per panel from different sampling sites,
Industrial Channel (A), power plant
outflow (B) and Chioggia (C) in different sampling dates after 20 (May 97), 40
(Jun 97),80 (Aug 97), 160 (Nov 97).230
(Jan 98) and :no (Apr 98) days from
panel immersion
1 p..
.... ., p..
~
400
300
200
-r4~
100
I
_L...i.
Balanus amphitrite in the Lagoon of Venice
I
Site
OA.
e B
!
I::l.C
I
I ::as:
b.
]£:
0
~
.=.
n
:m:
:m: ::lh: .c.
Table 2. '!Wo way ANOVA table for difference in mean dead
organisms/alive organisms ratio per panel among sampling
site and sampling dates. Industrial Channel station was
excluded from the analysis as the number of individuals per
panel was <20 in all sampling dates
Source
df
Mean square
P
Site
1
0.755
0.130
Date
5
0.930
0.038
Sitexdate
40.666
0.110
Error
15
0.294
3,0
2,5 •
1
2,0
p..
....
., p..
~
1,5
~
~
. ~
1,0
•
-a
-
,5
i.~ ~]I
0
•
-~ ~ :I:_
l
0,0
~.
I::l.
..
20
40
80
160
230
days
20
~
40
80
160
230
310
days
was very high, namely between 91 and 99%, at
Chioggia in August and November, respectively
(Table 3). Differences among stations and dates
were not significant (x 2 =43.1, df=32, P>O.05)
while, with respect to the Hardy-Weinberg equilibrium, significant deficiency of heterozygotes
were observed in populations from the power
plant outflow in August 97 (D=-O.229, P=O.OOl)
and in population from Chioggia in April 98
(D=-0.407, P=O.008). Since November 97 the
frequency of the most common allele at the
Site
I
oA.
e B
b.C
!
310
Fig. 2. Mean dead organisms/live organisms ratio
per panel from different
sampling sites, Industrial
Channel (A), power plant
outflow (B) and Chioggia (C)
in different sampling dates
after 20 (May 97), 40 (Jun
97), 80 (Aug 97), 160 (Nov
97), 230 (Jan 98) and 310
(Apr 98) days from panel
immersion
325