

306
M. Leonardi and S. Giacobbe
o 100
,
.
t m 500
A: Marinello
z
Co
o
°
CD
M
I
B: Mergolo
C: Verde
ID: Fondo porto
[ E: Porto vecchi
F: Nuovo
D Tyrrhenian sea
'=J
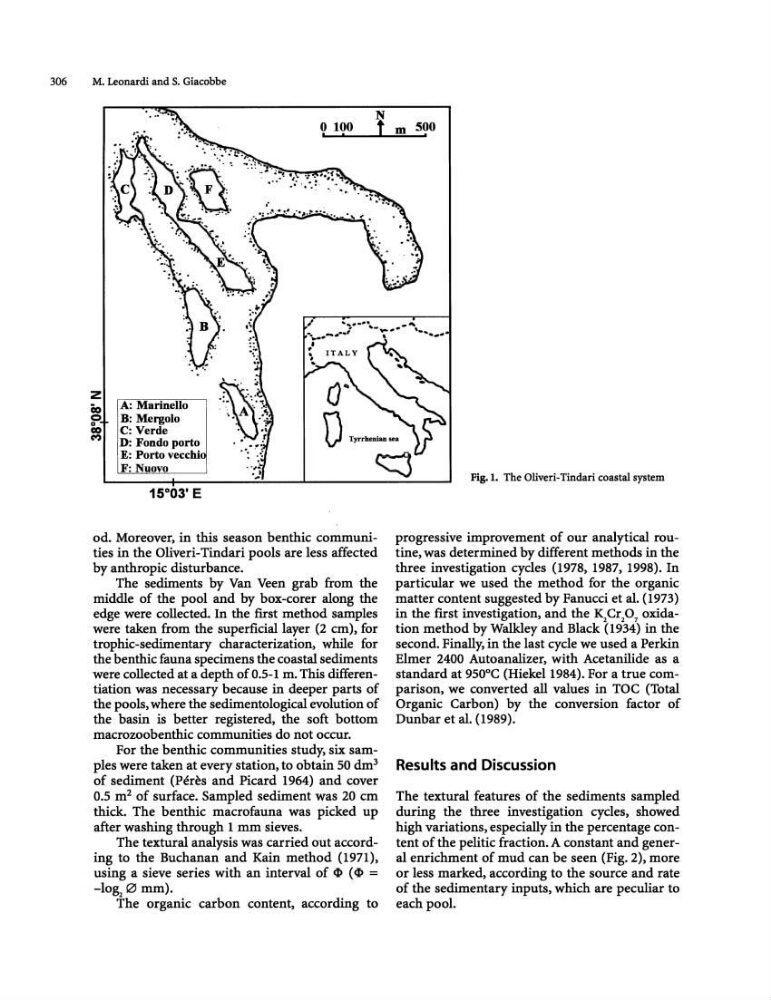
Fig.I. The Oliveri-Tindari coastal system
od. Moreover, in this season benthic communities in the Oliveri-Tindari pools are less affected
by anthropic disturbance.
The sediments by Van Veen grab from the
middle of the pool and by box-corer along the
edge were collected In the fIrst method samples
were taken from the superfIcial layer (2 em), for
trophic-sedimentary characterization. while for
the benthic fauna specimens the coastal sediments
were collected at a depth of 0.5-1 m. This differentiation was necessary because in deeper parts of
the pools, where the sedimentological evolution of
the basin is better registered, the soft bottom
macrozoobenthic communities do not occur.
For the benthic communities study, six samples were taken at every station. to obtain 50 dm 3
of sediment (Peres and Picard 1964) and cover
0.5 m 2 of surface. Sampled sediment was 20 em
thick. The benthic macrofauna was picked up
after washing through 1 mm sieves.
The textural analysis was carried out according to the Buchanan and Kain method (1971),
using a sieve series with an interval of ( =
-10~0 mm).
The organic carbon content, according to
progressive improvement of our analytical routine, was determined by different methods in the
three investigation cycles (1978, 1987, 1998). In
particular we used the method for the organic
matter content suggested by Fanucd et al. (1973)
in the fIrst investigation, and the K 2 Crp7 oxidation method by Walkley and Black (1934) in the
second. Finally, in the last cycle we used a Perkin
Elmer 2400 Autoanalizer, with Acetanilide as a
standard at 950°C (HiekeI1984). For a true comparison, we converted all values in TOC (Total
Organic Carbon) by the conversion factor of
Dunbar et al. (1989).
Results and Discussion
The textural features of the sediments sampled
during the three investigation cycles, showed
high variations, especially in the percentage content of the pelitic fraction. A constant and general enrichment of mud can be seen (Fig. 2), more
or less marked, according to the source and rate
of the sedimentary inputs, which are peculiar to
each pool.
M. Leonardi and S. Giacobbe
o 100
,
.
t m 500
A: Marinello
z
Co
o
°
CD
M
I
B: Mergolo
C: Verde
ID: Fondo porto
[ E: Porto vecchi
F: Nuovo
D Tyrrhenian sea
'=J
Fig.I. The Oliveri-Tindari coastal system
od. Moreover, in this season benthic communities in the Oliveri-Tindari pools are less affected
by anthropic disturbance.
The sediments by Van Veen grab from the
middle of the pool and by box-corer along the
edge were collected In the fIrst method samples
were taken from the superfIcial layer (2 em), for
trophic-sedimentary characterization. while for
the benthic fauna specimens the coastal sediments
were collected at a depth of 0.5-1 m. This differentiation was necessary because in deeper parts of
the pools, where the sedimentological evolution of
the basin is better registered, the soft bottom
macrozoobenthic communities do not occur.
For the benthic communities study, six samples were taken at every station. to obtain 50 dm 3
of sediment (Peres and Picard 1964) and cover
0.5 m 2 of surface. Sampled sediment was 20 em
thick. The benthic macrofauna was picked up
after washing through 1 mm sieves.
The textural analysis was carried out according to the Buchanan and Kain method (1971),
using a sieve series with an interval of ( =
-10~0 mm).
The organic carbon content, according to
progressive improvement of our analytical routine, was determined by different methods in the
three investigation cycles (1978, 1987, 1998). In
particular we used the method for the organic
matter content suggested by Fanucd et al. (1973)
in the fIrst investigation, and the K 2 Crp7 oxidation method by Walkley and Black (1934) in the
second. Finally, in the last cycle we used a Perkin
Elmer 2400 Autoanalizer, with Acetanilide as a
standard at 950°C (HiekeI1984). For a true comparison, we converted all values in TOC (Total
Organic Carbon) by the conversion factor of
Dunbar et al. (1989).
Results and Discussion
The textural features of the sediments sampled
during the three investigation cycles, showed
high variations, especially in the percentage content of the pelitic fraction. A constant and general enrichment of mud can be seen (Fig. 2), more
or less marked, according to the source and rate
of the sedimentary inputs, which are peculiar to
each pool.