

266
E. Dae1Ii and A. Occhipinti Ambrogi
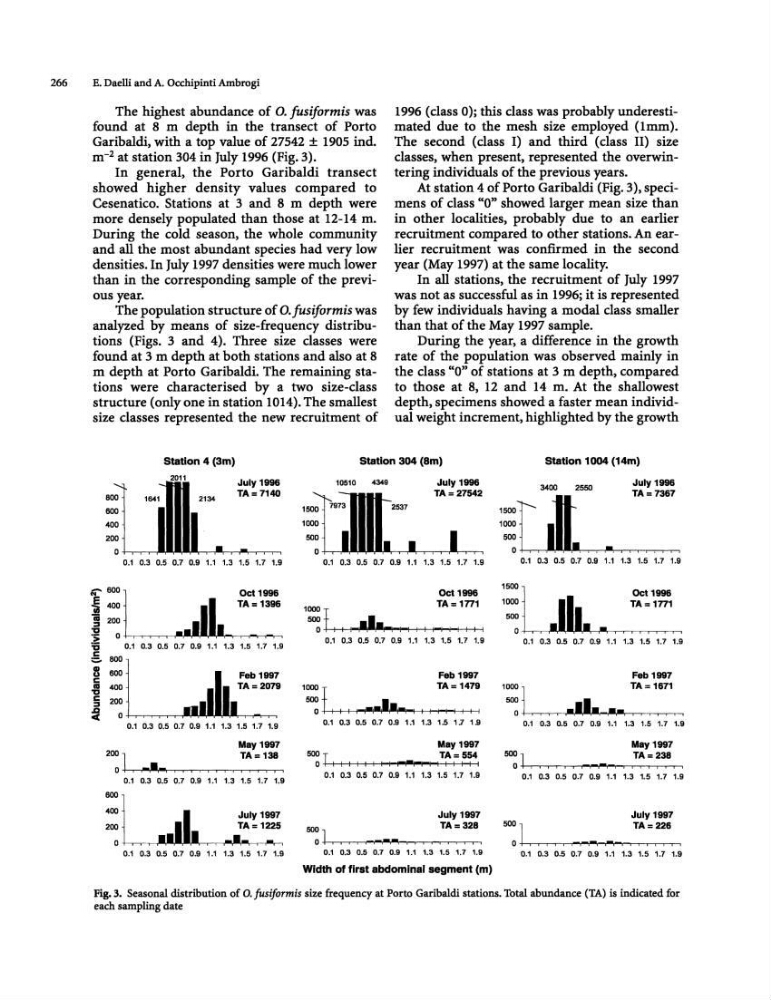
The highest abundance of O. fusiformis was
found at 8 m depth in the transect of Porto
Garibaldi, with a top value of 27542 ± 1905 indo
m- 2 at station 304 in July 1996 (Fig. 3),
In general, the Porto Garibaldi transect
showed higher density values compared to
Cesenatico. Stations at 3 and 8 m depth were
more densely populated than those at 12-14 m.
During the cold season, the whole community
and all the most abundant spedes had very low
densities. In July 1997 densities were much lower
than in the corresponding sample of the previous year.
The population structure of O. fusiformis was
analyzed by means of size-frequency distributions (Figs. 3 and 4). Three size classes were
found at 3 m depth at both stations and also at 8
m depth at Porto Garibaldi. The remaining stations were characterised by a two size-class
structure (only one in station 1014). The smallest
size classes represented the new recruitment of
1996 (class 0); this class was probably underestimated due to the mesh size employed (lmm).
The second (class I) and third (class II) size
classes, when present, represented the overwintering individuals of the previous years.
At station 4 of Porto Garibaldi (Fig. 3), specimens of class "0" showed larger mean size than
in other localities, probably due to an earlier
recruitment compared to other stations. An earlier recruitment was confirmed in the second
year(~ay1997)atthesameloca1ity.
In all stations, the recruitment of July 1997
was not as successful as in 1996; it is represented
by few individuals having a modal class smaller
than that of the ~ay 1997 sample.
During the year. a difference in the growth
rate of the population was observed mainly in
the class "0" of stations at 3 m depth. compared
to those at 8, 12 and 14 m. At the shallowest
depth, specimens showed a faster mean individual weight increment, highlighted by the growth
Station 4 (3m)
Station 304 (8m)
Station 1004 (14m)
July 1996
TA = 7140
0.1 0.3 0.5 0.7 0.9 1.1 1.3 1.5 1.7 1.9
G' 500 l
Oct 1996
-5 400
I TA = 1396
I 200
_ • • 1.
"S;
0
.,~,~~~""
I : j' 03 ~ ' ' ' ' ' ' 1
1
.
3 ::b 1~~:9
j :~1" ", ... IL~A=2079
0.1 0.3 0.5 0.7 0.9 1.1 1.3 1.5 1.7 1.9
May 1997
2~ +1...,...,.,-.., .• ~,i""-\-' ~..,.-,....,--,....,....,.....TA.......-T=--,1_38 ....
0.1 0.3 0.5 0.7 0.9 1.1 1.3 1.5 1.7 1.9
SOOL
:~ , •• 11. "
July 1997
TA= 1225
..... , ~
0.1 0.3 0.5 0.7 0.9 1.1 1.3 1.5 1.7 1.9
10510
4349
'~l.~ 1~,~,."
July 1996
TA = 27542
I
i
~f
0.1 0.3 0.5 0.7 0.9 1.1 1.3 1.5 1.7 1.9
Oct 1996
TA = 1771
1000 I
5~+ 11 , '''~'"I-H , 1 1 i I ! I I I
0.1 0.3 0.5 0.7 0.9 1.1 1.3 1.5 1.7 1.9
Feb 1997
1:1
TA=1479
(I 11 I I J"'"IIIJIIi.IIIW;., I 1 i"""'i-i I 1 I
0.1 0.3 0.5 0.7 0.9 1.1 1.3 1.5 1.7 1.9
May 1997
500 J
TA=554
01111111 II'"I-I"! III111 I
0.1 0.3 0.5 0.7 0.9 1.1 1.3 1.5 1.7 1.9
July 1997
TA=328
~l~~~~, ~,-~,-~, ~, ~, ,~~~~
0.1 0.3 0.5 0.7 0.9 1.1 1.3 1.5 1.7 1.9
Width of first abdominal segment (m)
3400
2550
July 1996
TA = 7367
1500f
I
1~:
I
o " r
, , , , • • , , , , , , ,
0.1 0.3 0.5 0.7 0.9 1.1 1.3 1.5 1.7 1.9
Oct 1996
TA=1771
0.1 0.3 0.5 0.7 0.9 1.1 1.3 1.5 1.7 1.9
Feb 1997
1~ +-J ~, ...-.~"'''I,11 .......... ., . ..",. ..... r,..... ~ ~ A ~ , ~ ~ - - , 1 . 6 _ ~ r - 1 ~ ,
0.1 0.3 0.5 0.7 0.9 1.1 1.3 1.5 1.7 1.9
May 1997
M~+-1~...,--,....,...~~,_,~~~~~~=--,2r-38rT<
0.1 0.3 0.5 0.1 0.9 1.1 1.3 1.5 1.7 1.9
July 1997
M:+-]~,~.--"_,~,~,~,~~.., . . . , , i " " _ ~ ' ~~~~~=~22-r-6~
0.1 0.3 0.5 0.7 0.9 1.1 1.3 1.5 1.7 1.9
Fig. 3. Seasonal distribution of O. fusiformis size frequency at Porto Garibaldi stations. Total abundance (TAl is indicated for
each sampling date
E. Dae1Ii and A. Occhipinti Ambrogi
The highest abundance of O. fusiformis was
found at 8 m depth in the transect of Porto
Garibaldi, with a top value of 27542 ± 1905 indo
m- 2 at station 304 in July 1996 (Fig. 3),
In general, the Porto Garibaldi transect
showed higher density values compared to
Cesenatico. Stations at 3 and 8 m depth were
more densely populated than those at 12-14 m.
During the cold season, the whole community
and all the most abundant spedes had very low
densities. In July 1997 densities were much lower
than in the corresponding sample of the previous year.
The population structure of O. fusiformis was
analyzed by means of size-frequency distributions (Figs. 3 and 4). Three size classes were
found at 3 m depth at both stations and also at 8
m depth at Porto Garibaldi. The remaining stations were characterised by a two size-class
structure (only one in station 1014). The smallest
size classes represented the new recruitment of
1996 (class 0); this class was probably underestimated due to the mesh size employed (lmm).
The second (class I) and third (class II) size
classes, when present, represented the overwintering individuals of the previous years.
At station 4 of Porto Garibaldi (Fig. 3), specimens of class "0" showed larger mean size than
in other localities, probably due to an earlier
recruitment compared to other stations. An earlier recruitment was confirmed in the second
year(~ay1997)atthesameloca1ity.
In all stations, the recruitment of July 1997
was not as successful as in 1996; it is represented
by few individuals having a modal class smaller
than that of the ~ay 1997 sample.
During the year. a difference in the growth
rate of the population was observed mainly in
the class "0" of stations at 3 m depth. compared
to those at 8, 12 and 14 m. At the shallowest
depth, specimens showed a faster mean individual weight increment, highlighted by the growth
Station 4 (3m)
Station 304 (8m)
Station 1004 (14m)
July 1996
TA = 7140
0.1 0.3 0.5 0.7 0.9 1.1 1.3 1.5 1.7 1.9
G' 500 l
Oct 1996
-5 400
I TA = 1396
I 200
_ • • 1.
"S;
0
.,~,~~~""
I : j' 03 ~ ' ' ' ' ' ' 1
1
.
3 ::b 1~~:9
j :~1" ", ... IL~A=2079
0.1 0.3 0.5 0.7 0.9 1.1 1.3 1.5 1.7 1.9
May 1997
2~ +1...,...,.,-.., .• ~,i""-\-' ~..,.-,....,--,....,....,.....TA.......-T=--,1_38 ....
0.1 0.3 0.5 0.7 0.9 1.1 1.3 1.5 1.7 1.9
SOOL
:~ , •• 11. "
July 1997
TA= 1225
..... , ~
0.1 0.3 0.5 0.7 0.9 1.1 1.3 1.5 1.7 1.9
10510
4349
'~l.~ 1~,~,."
July 1996
TA = 27542
I
i
~f
0.1 0.3 0.5 0.7 0.9 1.1 1.3 1.5 1.7 1.9
Oct 1996
TA = 1771
1000 I
5~+ 11 , '''~'"I-H , 1 1 i I ! I I I
0.1 0.3 0.5 0.7 0.9 1.1 1.3 1.5 1.7 1.9
Feb 1997
1:1
TA=1479
(I 11 I I J"'"IIIJIIi.IIIW;., I 1 i"""'i-i I 1 I
0.1 0.3 0.5 0.7 0.9 1.1 1.3 1.5 1.7 1.9
May 1997
500 J
TA=554
01111111 II'"I-I"! III111 I
0.1 0.3 0.5 0.7 0.9 1.1 1.3 1.5 1.7 1.9
July 1997
TA=328
~l~~~~, ~,-~,-~, ~, ~, ,~~~~
0.1 0.3 0.5 0.7 0.9 1.1 1.3 1.5 1.7 1.9
Width of first abdominal segment (m)
3400
2550
July 1996
TA = 7367
1500f
I
1~:
I
o " r
, , , , • • , , , , , , ,
0.1 0.3 0.5 0.7 0.9 1.1 1.3 1.5 1.7 1.9
Oct 1996
TA=1771
0.1 0.3 0.5 0.7 0.9 1.1 1.3 1.5 1.7 1.9
Feb 1997
1~ +-J ~, ...-.~"'''I,11 .......... ., . ..",. ..... r,..... ~ ~ A ~ , ~ ~ - - , 1 . 6 _ ~ r - 1 ~ ,
0.1 0.3 0.5 0.7 0.9 1.1 1.3 1.5 1.7 1.9
May 1997
M~+-1~...,--,....,...~~,_,~~~~~~=--,2r-38rT<
0.1 0.3 0.5 0.1 0.9 1.1 1.3 1.5 1.7 1.9
July 1997
M:+-]~,~.--"_,~,~,~,~~.., . . . , , i " " _ ~ ' ~~~~~=~22-r-6~
0.1 0.3 0.5 0.7 0.9 1.1 1.3 1.5 1.7 1.9
Fig. 3. Seasonal distribution of O. fusiformis size frequency at Porto Garibaldi stations. Total abundance (TAl is indicated for
each sampling date