

264
E. Daelli and A. Occhipinti Amhrogi
45· 00"
Porto Garibaldi
Cesena.tico
44° l r
'
1014
Km 0
10
= -
12°15" E
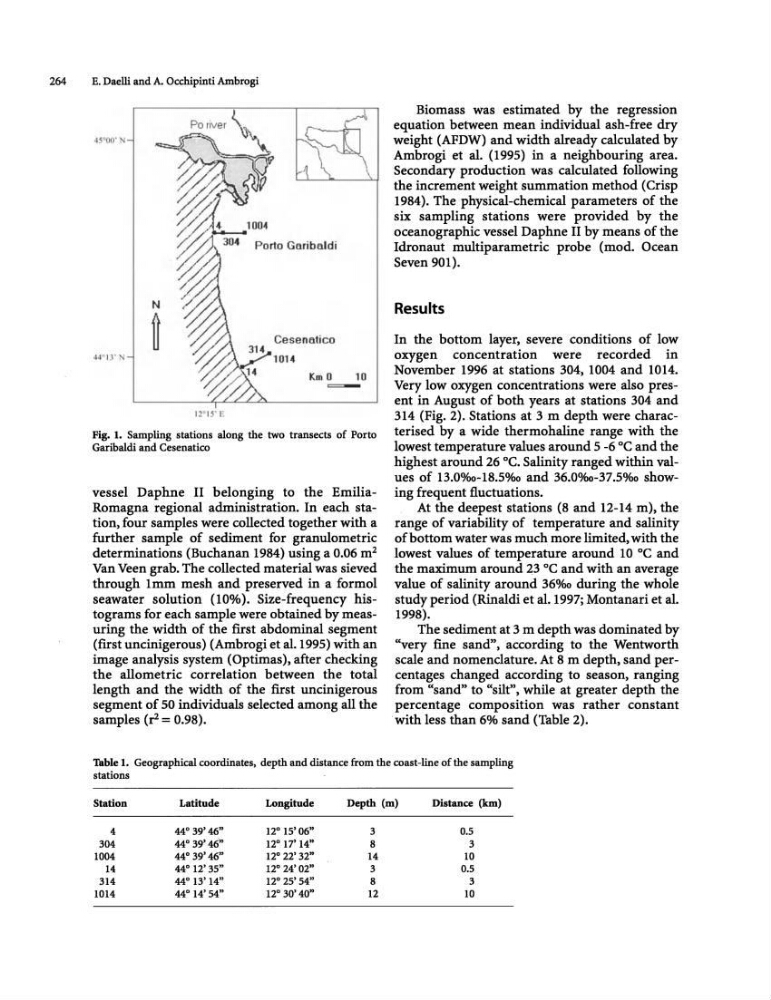
Fig. 1. Sampling stations along the two transects of Porto
Garibaldi and Cesenatico
vessel Daphne II belonging to the EmiliaRomagna regional administration. In each station, four samples were collected together with a
further sample of sediment for granulometric
determinations (Buchanan 1984) using a 0.06 m 2
Van Veen grab. The collected material was sieved
through Imm mesh and preserved in a formol
seawater solution (10%). Size-frequency histograms for each sample were obtained by measuring the width of the first abdominal segment
(frrst uncinigerous) (Ambrogi et al.1995) with an
image analysis system (Optimas), after checking
the allometric correlation between the total
length and the width of the first uncinigerous
segment of 50 individuals selected among all the
samples (rZ = 0.98).
Biomass was estimated by the regression
equation between mean individual ash-free dry
weight (AFDW) and width already calculated by
Ambrogi et al. (1995) in a neighbouring area.
Secondary production was calculated following
the increment weight summation method (Crisp
1984). The physical-chemical parameters of the
six sampling stations were provided by the
oceanographic vessel Daphne II by means of the
Idronaut multiparametric probe (mod. Ocean
Seven 901).
Results
In the bottom layer, severe conditions of low
oxygen concentration were recorded in
November 1996 at stations 304, 1004 and 1014.
Very low oxygen concentrations were also present in August of both years at stations 304 and
314 (Fig. 2). Stations at 3 m depth were characterised by a wide thermohaline range with the
lowest temperature values around 5 -6°C and the
highest around 26°C. Salinity ranged within values of 13.0%0-18.5%0 and 36.0%0-37.5%0 showing frequent fluctuations.
At the deepest stations (8 and 12-14 m), the
range of variability of temperature and salinity
of bottom water was much more limited, with the
lowest values of temperature around 10°C and
the maximum around 23 °C and with an average
value of salinity around 36%0 during the whole
study period (Rinaldi et al.1997; Montanari et al.
1998).
The sediment at 3 m depth was dominated by
"very fine sand", according to the Wentworth
scale and nomenclature. At 8 m depth. sand percentages changed according to season, ranging
from "sand" to "silt", while at greater depth the
percentage composition was rather constant
. with less than 6% sand (Table 2).
Table 1. Geographical coordinates, depth and distance from the coast-line of the sampling
stations
Station
Latitude
Longitude
Depth (m)
Distance (kID)
4
44° 39'46"
12° 15' 06"
3
0.5
304
44° 39'46"
12° 17' 14"
8
3
1004
44° 39' 46"
12° 22' 32"
14
10
14
44° 12' 35"
12° 24' 02"
3
0.5
314
44° 13'14"
12° 25' 54"
8
3
1014
44° 14' 54"
12° 30'40"
12
10
E. Daelli and A. Occhipinti Amhrogi
45· 00"
Porto Garibaldi
Cesena.tico
44° l r
'
1014
Km 0
10
= -
12°15" E
Fig. 1. Sampling stations along the two transects of Porto
Garibaldi and Cesenatico
vessel Daphne II belonging to the EmiliaRomagna regional administration. In each station, four samples were collected together with a
further sample of sediment for granulometric
determinations (Buchanan 1984) using a 0.06 m 2
Van Veen grab. The collected material was sieved
through Imm mesh and preserved in a formol
seawater solution (10%). Size-frequency histograms for each sample were obtained by measuring the width of the first abdominal segment
(frrst uncinigerous) (Ambrogi et al.1995) with an
image analysis system (Optimas), after checking
the allometric correlation between the total
length and the width of the first uncinigerous
segment of 50 individuals selected among all the
samples (rZ = 0.98).
Biomass was estimated by the regression
equation between mean individual ash-free dry
weight (AFDW) and width already calculated by
Ambrogi et al. (1995) in a neighbouring area.
Secondary production was calculated following
the increment weight summation method (Crisp
1984). The physical-chemical parameters of the
six sampling stations were provided by the
oceanographic vessel Daphne II by means of the
Idronaut multiparametric probe (mod. Ocean
Seven 901).
Results
In the bottom layer, severe conditions of low
oxygen concentration were recorded in
November 1996 at stations 304, 1004 and 1014.
Very low oxygen concentrations were also present in August of both years at stations 304 and
314 (Fig. 2). Stations at 3 m depth were characterised by a wide thermohaline range with the
lowest temperature values around 5 -6°C and the
highest around 26°C. Salinity ranged within values of 13.0%0-18.5%0 and 36.0%0-37.5%0 showing frequent fluctuations.
At the deepest stations (8 and 12-14 m), the
range of variability of temperature and salinity
of bottom water was much more limited, with the
lowest values of temperature around 10°C and
the maximum around 23 °C and with an average
value of salinity around 36%0 during the whole
study period (Rinaldi et al.1997; Montanari et al.
1998).
The sediment at 3 m depth was dominated by
"very fine sand", according to the Wentworth
scale and nomenclature. At 8 m depth. sand percentages changed according to season, ranging
from "sand" to "silt", while at greater depth the
percentage composition was rather constant
. with less than 6% sand (Table 2).
Table 1. Geographical coordinates, depth and distance from the coast-line of the sampling
stations
Station
Latitude
Longitude
Depth (m)
Distance (kID)
4
44° 39'46"
12° 15' 06"
3
0.5
304
44° 39'46"
12° 17' 14"
8
3
1004
44° 39' 46"
12° 22' 32"
14
10
14
44° 12' 35"
12° 24' 02"
3
0.5
314
44° 13'14"
12° 25' 54"
8
3
1014
44° 14' 54"
12° 30'40"
12
10