

178
R. Casotti et aL
attaining 10 3 cell/mI, and were present mostly
at the surface of coastal stations (data not
shown). No parameter allowed us to identify
them at the taxonomic level. Cyanobacteria represented 65% (SO ±24%) of ultraphytoplankton
Carbon, Prochlorophytes 15% (SO±22%), while
picoeukaryotes accounted for 21% (SO ±16%).
Bacteria
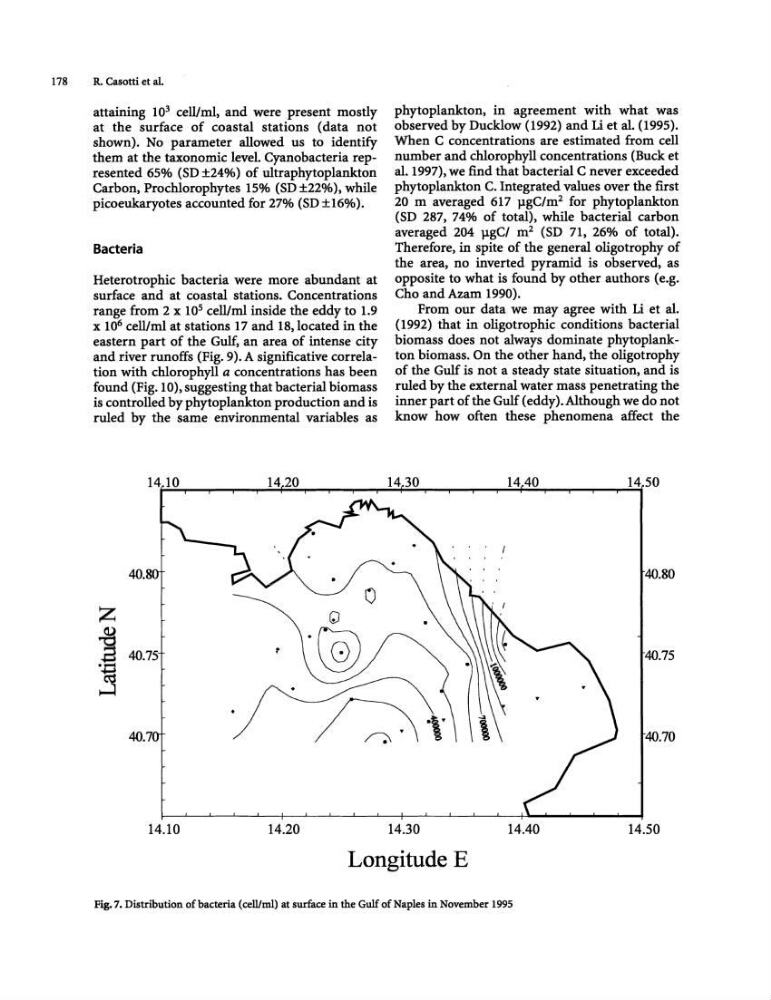
Heterotrophic bacteria were more abundant at
surface and at coastal stations. Concentrations
range from 2 x 10 5 ce11!m1 inside the eddy to 1.9
x 10 6 ce11!ml at stations 11 and 18, located in the
eastern part of the Gulf, an area of intense city
and dver runoffs (Fig. 9). A significative correlation with chlorophyll a concentrations has been
found (Fig. 10), suggesting that bacterial biomass
is controlled by phytoplankton production and is
ruled by the same environmental variables as
14 10
40.
Z
~
.g 40.75
j
40.7
14.10
14.20
phytoplankton. in agreement with what was
observed by Ducklow (1992) and Li et al. (1995).
When C concentrations are estimated from cell
number and chlorophyll concentrations (Buck et
al. 1991), we find that bacterial C never exceeded
phytoplankton C. Integrated values over the first
20 m averaged 611 pgC/m2 for phytoplankton
(SO 287, 74% of total), while bacterial carbon
averaged 204 pgCI m 2 (SO 71, 26% of total).
Therefore, in spite of the general oligotrophy of
the area, no inverted pyramid is observed, as
opposite to what is found by other authors (e.g.
Cho andAzam 1990).
From our data we may agree with Li et al.
(1992) that in oligotrophic conditions bacterial
biomass does not always dominate phytoplankton biomass. On the other hand, the oligotrophy
of the Gulf is not a steady state situation, and is
ruled by the external water mass penetrating the
inner part of the Gulf (eddy). Although we do not
know how often these phenomena affect the
1450
40.80
40.75
40.70
14.30
14.40
14.50
Longitude E
Fig. 7. Distribution of bacteria (ceIllml) at surface in the Gulf of Naples in November 1995
R. Casotti et aL
attaining 10 3 cell/mI, and were present mostly
at the surface of coastal stations (data not
shown). No parameter allowed us to identify
them at the taxonomic level. Cyanobacteria represented 65% (SO ±24%) of ultraphytoplankton
Carbon, Prochlorophytes 15% (SO±22%), while
picoeukaryotes accounted for 21% (SO ±16%).
Bacteria
Heterotrophic bacteria were more abundant at
surface and at coastal stations. Concentrations
range from 2 x 10 5 ce11!m1 inside the eddy to 1.9
x 10 6 ce11!ml at stations 11 and 18, located in the
eastern part of the Gulf, an area of intense city
and dver runoffs (Fig. 9). A significative correlation with chlorophyll a concentrations has been
found (Fig. 10), suggesting that bacterial biomass
is controlled by phytoplankton production and is
ruled by the same environmental variables as
14 10
40.
Z
~
.g 40.75
j
40.7
14.10
14.20
phytoplankton. in agreement with what was
observed by Ducklow (1992) and Li et al. (1995).
When C concentrations are estimated from cell
number and chlorophyll concentrations (Buck et
al. 1991), we find that bacterial C never exceeded
phytoplankton C. Integrated values over the first
20 m averaged 611 pgC/m2 for phytoplankton
(SO 287, 74% of total), while bacterial carbon
averaged 204 pgCI m 2 (SO 71, 26% of total).
Therefore, in spite of the general oligotrophy of
the area, no inverted pyramid is observed, as
opposite to what is found by other authors (e.g.
Cho andAzam 1990).
From our data we may agree with Li et al.
(1992) that in oligotrophic conditions bacterial
biomass does not always dominate phytoplankton biomass. On the other hand, the oligotrophy
of the Gulf is not a steady state situation, and is
ruled by the external water mass penetrating the
inner part of the Gulf (eddy). Although we do not
know how often these phenomena affect the
1450
40.80
40.75
40.70
14.30
14.40
14.50
Longitude E
Fig. 7. Distribution of bacteria (ceIllml) at surface in the Gulf of Naples in November 1995