

164
M. Campolmi et al.
100
90
80
70
60
50
40
30
10
I
I
I
I
a
o
18:00
13:00
8:00
15:00
3:00
100
90
80
70
60
50
40
30
20
10
b
0
3:00
20:00
16:00
9:00
15:00
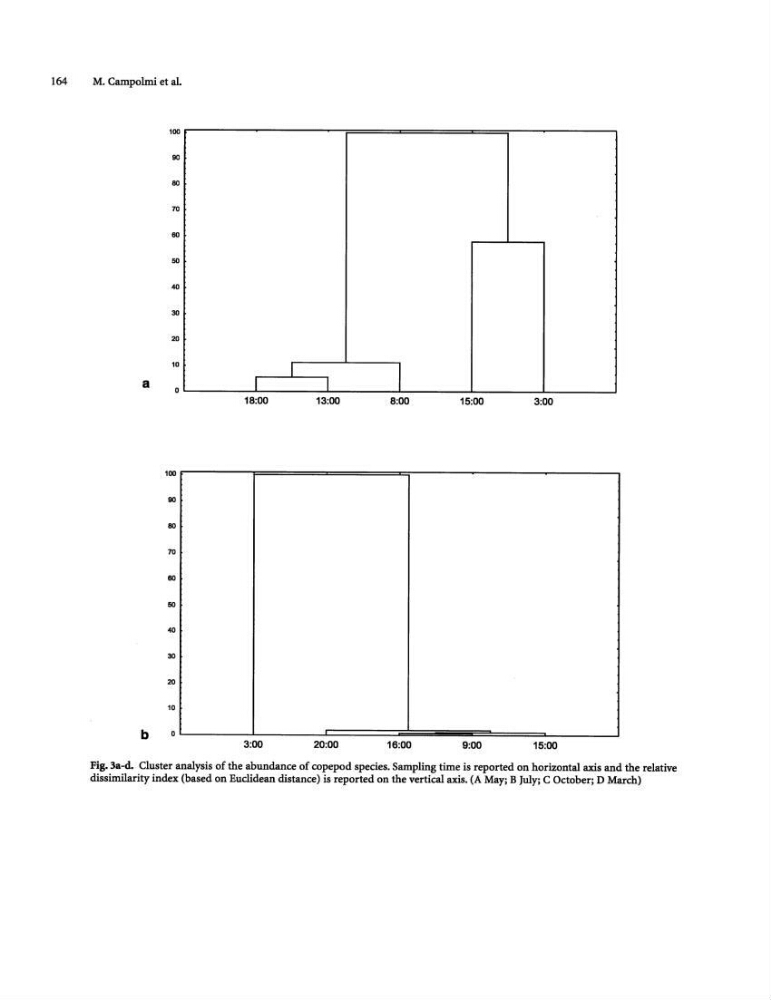
Fig. 3a-d. Cluster analysis of the abundance of copepod species. Sampling time is reported on horizontal axis and the relative
dissimilarity index (based on Euclidean distance) is reported on the vertical axis. (A May; B July; C October; D March)
M. Campolmi et al.
100
90
80
70
60
50
40
30
10
I
I
I
I
a
o
18:00
13:00
8:00
15:00
3:00
100
90
80
70
60
50
40
30
20
10
b
0
3:00
20:00
16:00
9:00
15:00
Fig. 3a-d. Cluster analysis of the abundance of copepod species. Sampling time is reported on horizontal axis and the relative
dissimilarity index (based on Euclidean distance) is reported on the vertical axis. (A May; B July; C October; D March)