

A ODC Study on Organic Matter in Semi-enclosed Mediterranean Marine System
109
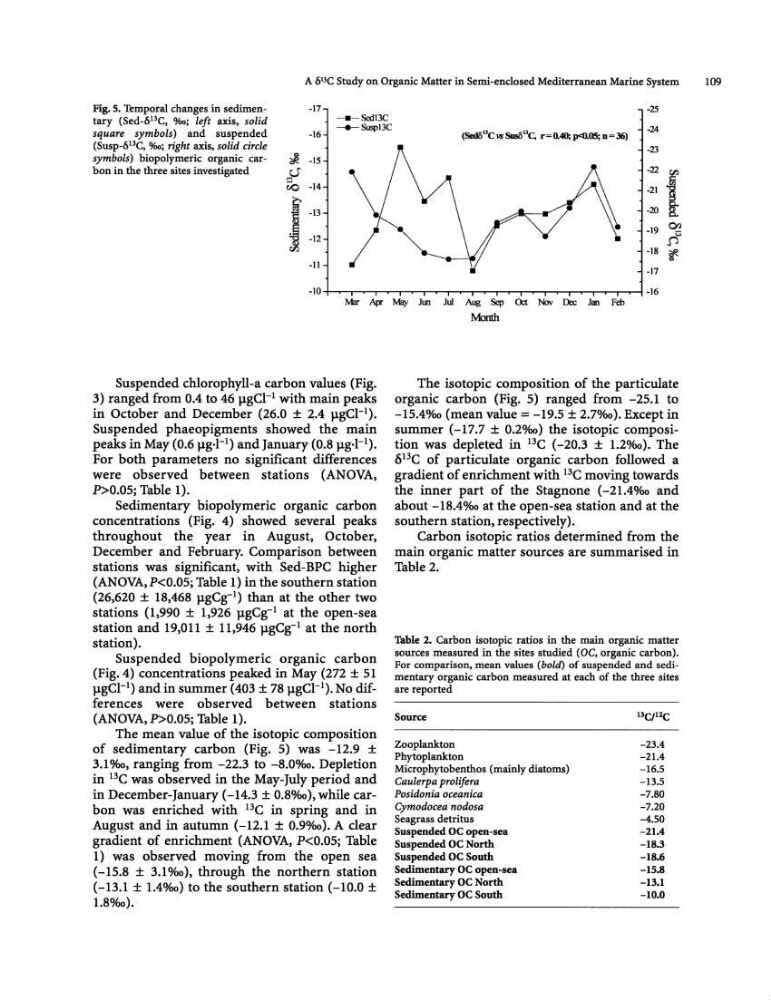
Fig. 5. Temporal changes in sedimentary (Sed-ollC, %0; left axis, solid
square symbols) and suspended
(SUSp-013C, %0; right axis, solid circle
symbols) biopolymeric organic carbon in the three sites investigated
-17
-16
?R -15
,.,U'
CAo -14
,i
I3
~ -12
-11
-_Sed13C
-'-SuspI3C
-25
(Sed5uC 105 Sus/)lJc, r=ft4O; p
-24
-23
-22
I
-21
-20
-19 O?
sf
-18
t-17
-16
Mar Apr May JUIl Jul Aug Sep O::t 'Nov n:c .Jan Feb
Suspended chlorophyll-a carbon values (Fig.
3) ranged from 0.4 to 46 JlgCI-l with main peaks
in October and December (26.0 ± 2.4 JlgCI-l).
Suspended phaeopigments showed the main
peaks in May (0.6 Jlg·l- 1 ) and January (0.8 Jlg.l- 1 ).
For both parameters no significant differences
were observed between stations (ANOVA,
P>0.05; Table 1).
Sedimentary biopolymeric organic carbon
concentrations (Fig. 4) showed several peaks
throughout the year in August, October,
December and February. Comparison between
stations was significant. with Sed-BPC higher
(ANOVA,P
stations (1,990 ± 1,926 JlgCg- 1 at the open-sea
station and 19,011 ± 11,946 JlgCg- 1 at the north
station).
Suspended biopolymeric organic carbon
(Fig. 4) concentrations peaked in May (272 ± 51
llgCI-l) and in summer (403 ± 7811gCl-1). No differences were observed between stations
(ANOVA, P>O.05; Table 1).
The mean value of the isotopic composition
of sedimentary carbon (Fig. 5) was -12.9 ±
3.1 %0, ranging from -22.3 to -8.0%0. Depletion
in 13C was observed in the May-July period and
in December-January (-14.3 ± 0.8%0), while carbon was enriched with 13C in spring and in
August and in autumn (-12.1 ± 0.9%0). A dear
gradient of enrichment (AN OVA, P
(-IS.8 ± 3.1%0), through the northern station
(-13.1 ± 1.4%0) to the southern station (-10.0 ±
1.8%0),
Month
The isotopic composition of the particulate
organic carbon (Fig. 5) ranged from -2S.1 to
-15.4%0 (mean value = -19.5 ± 2.7%0). Except in
swnmer (-17.7 ± 0.2%0) the isotopic composition was depleted in DC (-20.3 ± 1.2%0). The
ODC of particulate organic carbon followed a
gradient of enrichment with DC moving towards
the inner part of the Stagnone (-21.4%0 and
about -18.4%0 at the open-sea station and at the
southern station, respectively).
Carbon isotopic ratios determined from the
main organic matter sources are summarised in
Table 2.
Table 2. Carbon isotopic ratios in the main organic matter
sources measured in the sites studied (DC, organic carbon).
For comparison, mean values (bold) of suspended and sedimentary organic carbon measured at each of the three sites
are reported
Source
Zooplankton
Phytoplankton
Microphytobenthos (mainly diatoms)
Caulerpa prolifera
Posidonia oceanica
Cymodocea nodosa
Seagrass detritus
Suspended OC open-sea
Suspended OC North
Suspended OC South
Sedimentary OC open-sea
Sedimentary OC North
Sedimentary OC South
-23.4
-21.4
-16.5
-13.5
-7.80
-7.20
-4.50
-21.4
-18.3
-18.6
-15.8
-13.1
-10.0
109
Fig. 5. Temporal changes in sedimentary (Sed-ollC, %0; left axis, solid
square symbols) and suspended
(SUSp-013C, %0; right axis, solid circle
symbols) biopolymeric organic carbon in the three sites investigated
-17
-16
?R -15
,.,U'
CAo -14
,i
I3
~ -12
-11
-_Sed13C
-'-SuspI3C
-25
(Sed5uC 105 Sus/)lJc, r=ft4O; p
-23
-22
I
-21
-20
-19 O?
sf
-18
t-17
-16
Mar Apr May JUIl Jul Aug Sep O::t 'Nov n:c .Jan Feb
Suspended chlorophyll-a carbon values (Fig.
3) ranged from 0.4 to 46 JlgCI-l with main peaks
in October and December (26.0 ± 2.4 JlgCI-l).
Suspended phaeopigments showed the main
peaks in May (0.6 Jlg·l- 1 ) and January (0.8 Jlg.l- 1 ).
For both parameters no significant differences
were observed between stations (ANOVA,
P>0.05; Table 1).
Sedimentary biopolymeric organic carbon
concentrations (Fig. 4) showed several peaks
throughout the year in August, October,
December and February. Comparison between
stations was significant. with Sed-BPC higher
(ANOVA,P
stations (1,990 ± 1,926 JlgCg- 1 at the open-sea
station and 19,011 ± 11,946 JlgCg- 1 at the north
station).
Suspended biopolymeric organic carbon
(Fig. 4) concentrations peaked in May (272 ± 51
llgCI-l) and in summer (403 ± 7811gCl-1). No differences were observed between stations
(ANOVA, P>O.05; Table 1).
The mean value of the isotopic composition
of sedimentary carbon (Fig. 5) was -12.9 ±
3.1 %0, ranging from -22.3 to -8.0%0. Depletion
in 13C was observed in the May-July period and
in December-January (-14.3 ± 0.8%0), while carbon was enriched with 13C in spring and in
August and in autumn (-12.1 ± 0.9%0). A dear
gradient of enrichment (AN OVA, P
(-IS.8 ± 3.1%0), through the northern station
(-13.1 ± 1.4%0) to the southern station (-10.0 ±
1.8%0),
Month
The isotopic composition of the particulate
organic carbon (Fig. 5) ranged from -2S.1 to
-15.4%0 (mean value = -19.5 ± 2.7%0). Except in
swnmer (-17.7 ± 0.2%0) the isotopic composition was depleted in DC (-20.3 ± 1.2%0). The
ODC of particulate organic carbon followed a
gradient of enrichment with DC moving towards
the inner part of the Stagnone (-21.4%0 and
about -18.4%0 at the open-sea station and at the
southern station, respectively).
Carbon isotopic ratios determined from the
main organic matter sources are summarised in
Table 2.
Table 2. Carbon isotopic ratios in the main organic matter
sources measured in the sites studied (DC, organic carbon).
For comparison, mean values (bold) of suspended and sedimentary organic carbon measured at each of the three sites
are reported
Source
Zooplankton
Phytoplankton
Microphytobenthos (mainly diatoms)
Caulerpa prolifera
Posidonia oceanica
Cymodocea nodosa
Seagrass detritus
Suspended OC open-sea
Suspended OC North
Suspended OC South
Sedimentary OC open-sea
Sedimentary OC North
Sedimentary OC South
-23.4
-21.4
-16.5
-13.5
-7.80
-7.20
-4.50
-21.4
-18.3
-18.6
-15.8
-13.1
-10.0