

R4
5 Spatial and Temporal Dlstrioutlon Patterns
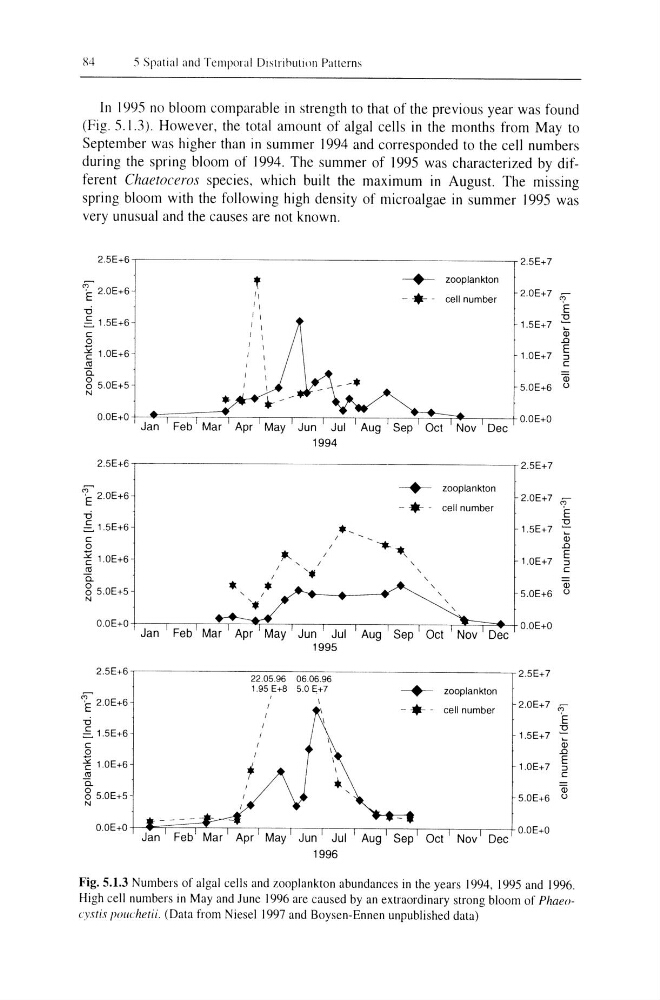
In 1995 no bloom comparable in strength to that of the previous year was found
(Fig. 5.1.3). However, the total amount of algal cells in the months from May to
September was higher than in summer 1994 and corresponded to the cell numbers
during the spring bloom of 1994. The summer of 1995 was characterized by different Chaetoceros species, which built the maximum in August. The missing
spring bloom with the following high density of microalgae in summer 1995 was
very unusual and the causes are not known.
2.SE+6
2.SE+7
f0
~
----+-- zooplankton
E 20E+6
-*- cell number
2.0E+7 i?
-c:i
E
~ 1.SE+6
1.SE+7
~
(j;
C
..0
0
E
~ 1.0E+6
1.0E+7 :::J
C1l
C
Ci.
Q)
g S.OE+S
S.OE+6
()
N
. .
O.OE+O
O.OE+O
Jan Feb Mar Apr May Jun Jul Aug Sep Oct Nov Dec
1994
2.5E+6
["' .'
[0
----+-- zooplankton
E 2.0E+6
-*
cell number
EO
2.0E+7
E
-c:i
~ 1.5E+6
*1.5E+7
~
(j;
c
'*- .. ,
..0
0
;...
E
~ 1.0E+6
I
1.0E+7
I
:::J
C1l
'*
,
c
Ci.
I
,
g S.OE+5
* *
Q)
5.0E+6
()
I
N
'*
O.OE+O
O.OE+O
Jan
Dec
2.SE+6
22.05.96 060696
2.5E+7
1.95 E+8 5.0 E.+7
----+-- zooplankton
[0
'E 20E+6
-*- cell number
2.0E+7 iil
'E
-c:i
I
~
~ 1.SE+6
I
1.SE+7 (j;
c
0
..0
~ 1.0E+6
1.0E+7
E
f
:::J
C1l
C
Ci.
Q)
g S.OE+5
5.0E+6
()
N
O.OE+O
O.OE+O
Jan Feb Mar Apr May Jun Jul Aug Sep Oct Nov Dec
1996
Fig. 5.1.3 Numbers of algal cells and zooplankton abundances in the years 1994, 1995 and 1996.
High cell numbers in May and June 1996 are caused by an extraordinary strong bloom of Phaeocystis pOllchl'tii. (Data from Niesel 1997 and Boysen-Ennen unpublished data)
5 Spatial and Temporal Dlstrioutlon Patterns
In 1995 no bloom comparable in strength to that of the previous year was found
(Fig. 5.1.3). However, the total amount of algal cells in the months from May to
September was higher than in summer 1994 and corresponded to the cell numbers
during the spring bloom of 1994. The summer of 1995 was characterized by different Chaetoceros species, which built the maximum in August. The missing
spring bloom with the following high density of microalgae in summer 1995 was
very unusual and the causes are not known.
2.SE+6
2.SE+7
f0
~
----+-- zooplankton
E 20E+6
-*- cell number
2.0E+7 i?
-c:i
E
~ 1.SE+6
1.SE+7
~
(j;
C
..0
0
E
~ 1.0E+6
1.0E+7 :::J
C1l
C
Ci.
Q)
g S.OE+S
S.OE+6
()
N
. .
O.OE+O
O.OE+O
Jan Feb Mar Apr May Jun Jul Aug Sep Oct Nov Dec
1994
2.5E+6
["' .'
[0
----+-- zooplankton
E 2.0E+6
-*
cell number
EO
2.0E+7
E
-c:i
~ 1.5E+6
*1.5E+7
~
(j;
c
'*- .. ,
..0
0
;...
E
~ 1.0E+6
I
1.0E+7
I
:::J
C1l
'*
,
c
Ci.
I
,
g S.OE+5
* *
Q)
5.0E+6
()
I
N
'*
O.OE+O
O.OE+O
Jan
Dec
2.SE+6
22.05.96 060696
2.5E+7
1.95 E+8 5.0 E.+7
----+-- zooplankton
[0
'E 20E+6
-*- cell number
2.0E+7 iil
'E
-c:i
I
~
~ 1.SE+6
I
1.SE+7 (j;
c
0
..0
~ 1.0E+6
1.0E+7
E
f
:::J
C1l
C
Ci.
Q)
g S.OE+5
5.0E+6
()
N
O.OE+O
O.OE+O
Jan Feb Mar Apr May Jun Jul Aug Sep Oct Nov Dec
1996
Fig. 5.1.3 Numbers of algal cells and zooplankton abundances in the years 1994, 1995 and 1996.
High cell numbers in May and June 1996 are caused by an extraordinary strong bloom of Phaeocystis pOllchl'tii. (Data from Niesel 1997 and Boysen-Ennen unpublished data)