

5R
4 Statistical Models and Techll1quC.,
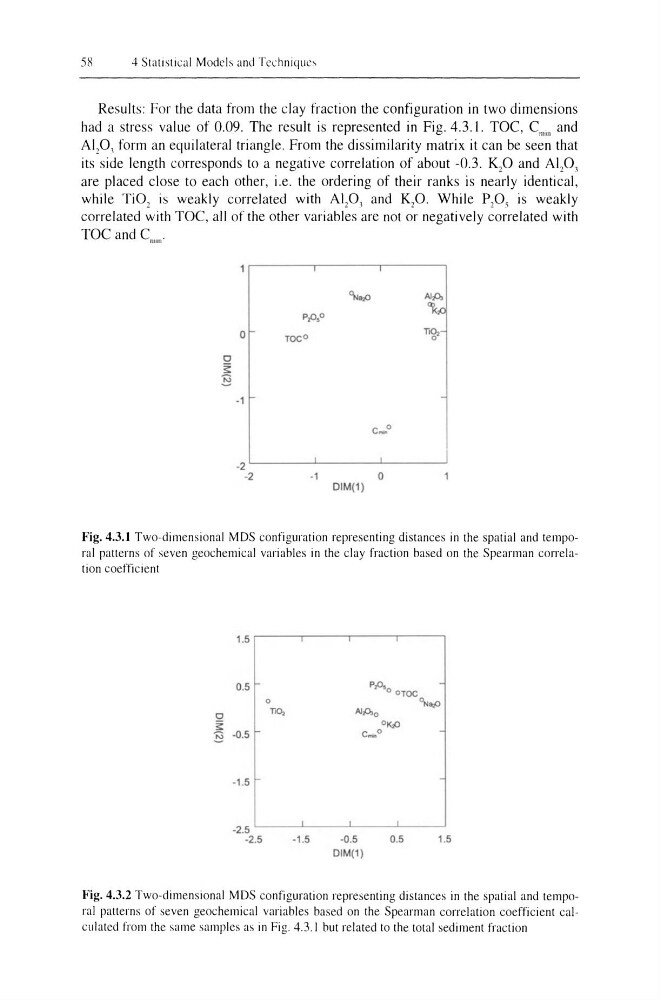
Results: For the data from the clay fraction the configuration in two dimensions
had a stress value of 0.09. The result is represented in Fig. 4.3.1. TOe, em,,, and
AlP, form an equilateral triangle. From the dissimilarity matrix it can be seen that
its side length corresponds to a negative correlation of about -0.3. Kp and AIPl
are placed close to each other, i.e. the ordering of their ranks is nearly identical,
while Ti0 2 is weakly correlated with AlP, and Kp. While P,O, is weakly
correlated with TOe, all of the other variables are not or negatively correlated with
TOe and em",
'l..,o
't
P,o.o
0
TOC O
li~
0
3:
B
-1
c,.,o
·2
-2
-1
0
OIM(l)
Fig. 4.3.1 Two-dimensional MDS configuration representing distances in the spatial and temporal patterns of seven geochemical variables in the clay fraction based on the Spearman correlation coefficient
0
~
B
1.5
0.5
pp.
o OTOC
0
"1..,0
no,
NAo
o K,O
-0.5
c_ o
-1.5
-2.5 '-----'-- - - - ' - - - - - ' ' - - - - '
-2.5
-1.5
-0.5
OIM(l)
0.5
1.5
Fig. 4.3.2 Two-dimensional MDS configuration representing distances in the spatial and temporal patterns of seven geochemical variables based on the Spearman correlation coefficient calculated from the same samples as in Fig. 4.3.1 but related to the total sediment fraction
4 Statistical Models and Techll1quC.,
Results: For the data from the clay fraction the configuration in two dimensions
had a stress value of 0.09. The result is represented in Fig. 4.3.1. TOe, em,,, and
AlP, form an equilateral triangle. From the dissimilarity matrix it can be seen that
its side length corresponds to a negative correlation of about -0.3. Kp and AIPl
are placed close to each other, i.e. the ordering of their ranks is nearly identical,
while Ti0 2 is weakly correlated with AlP, and Kp. While P,O, is weakly
correlated with TOe, all of the other variables are not or negatively correlated with
TOe and em",
'l..,o
't
P,o.o
0
TOC O
li~
0
3:
B
-1
c,.,o
·2
-2
-1
0
OIM(l)
Fig. 4.3.1 Two-dimensional MDS configuration representing distances in the spatial and temporal patterns of seven geochemical variables in the clay fraction based on the Spearman correlation coefficient
0
~
B
1.5
0.5
pp.
o OTOC
0
"1..,0
no,
NAo
o K,O
-0.5
c_ o
-1.5
-2.5 '-----'-- - - - ' - - - - - ' ' - - - - '
-2.5
-1.5
-0.5
OIM(l)
0.5
1.5
Fig. 4.3.2 Two-dimensional MDS configuration representing distances in the spatial and temporal patterns of seven geochemical variables based on the Spearman correlation coefficient calculated from the same samples as in Fig. 4.3.1 but related to the total sediment fraction