

3 Study Area
~
2l 1039
.s 1013
~ 987
:J
l:l1039
~ 1013
u 987
~ 1039
5} 1013
~ 987
(U
Jan Feb Mar Apr May Jun Jul Aug Sep Oct Nov Dec
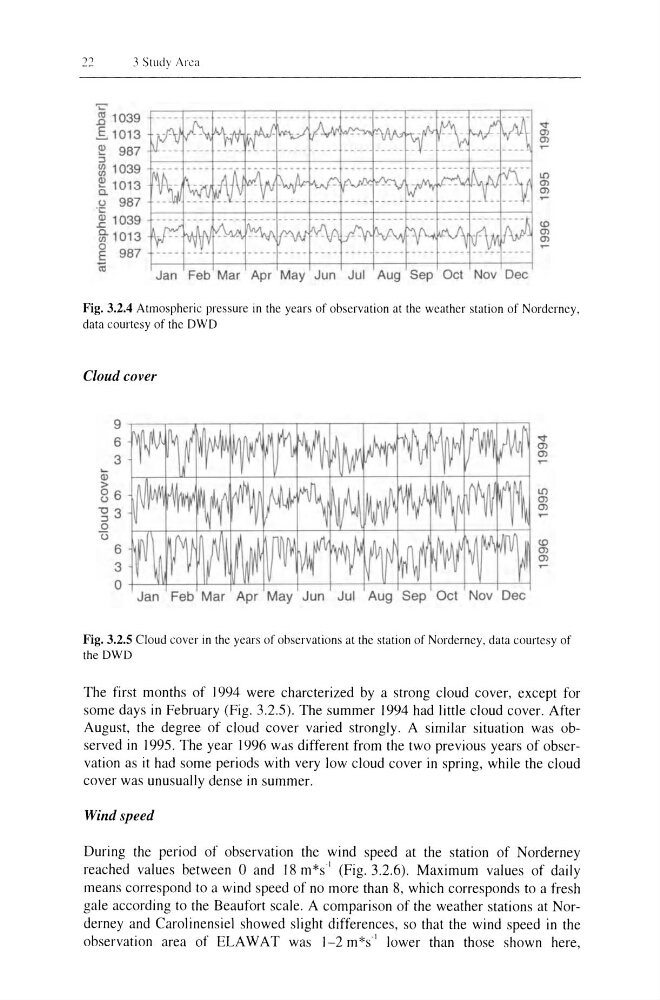
Fig. 3.2.4 Atmospheric pressure in the years of observation at the weather station of Norderney,
data courtesy of the DWD
Cloud cover
'Q)
>
9 ~--~~--~--~--~--~--.---.--.--~---r~
6
3
86
-g3
o
"'0
6
3
o ~~~-4~~~~ __ ~ __ +-__ ~~~~ __ -+-L~~
Jan Feb Mar Apr May Jun Jul Aug Sep Oct Nov Dec
"
CJ)
LrJ
CJ)
CJ)
<0
CJ)
CJ)
Fig. 3.2.5 Cloud cover in the years of observations at the station of Norderney, data courtesy of
the DWD
The first months of 1994 were charcterized by a strong cloud cover, except for
some days in February (Fig. 3.2.5). The summer 1994 had little cloud cover. After
August, the degree of cloud cover varied strongly. A similar situation was observed in 1995. The year 1996 WdS different from the two previous years of observation as it had some periods with very low cloud cover in spring, while the cloud
cover was unusually dense in summer.
Wind speed
During the period of observation the wind speed at the station of Norderney
reached values between () and 18 m*s' (Fig. 3.2.6). Maximum values of daily
means correspond to a wind speed of no more than 8, which corresponds to a fresh
gale according to the Beaufort scale. A comparison of the weather stations at Norderney and Carolinensiel showed slight differences, so that the wind speed in the
observation area of ELA W A Twas 1-2 m*s" lower than those shown here,
~
2l 1039
.s 1013
~ 987
:J
l:l1039
~ 1013
u 987
~ 1039
5} 1013
~ 987
(U
Jan Feb Mar Apr May Jun Jul Aug Sep Oct Nov Dec
Fig. 3.2.4 Atmospheric pressure in the years of observation at the weather station of Norderney,
data courtesy of the DWD
Cloud cover
'Q)
>
9 ~--~~--~--~--~--~--.---.--.--~---r~
6
3
86
-g3
o
"'0
6
3
o ~~~-4~~~~ __ ~ __ +-__ ~~~~ __ -+-L~~
Jan Feb Mar Apr May Jun Jul Aug Sep Oct Nov Dec
"
CJ)
LrJ
CJ)
CJ)
<0
CJ)
CJ)
Fig. 3.2.5 Cloud cover in the years of observations at the station of Norderney, data courtesy of
the DWD
The first months of 1994 were charcterized by a strong cloud cover, except for
some days in February (Fig. 3.2.5). The summer 1994 had little cloud cover. After
August, the degree of cloud cover varied strongly. A similar situation was observed in 1995. The year 1996 WdS different from the two previous years of observation as it had some periods with very low cloud cover in spring, while the cloud
cover was unusually dense in summer.
Wind speed
During the period of observation the wind speed at the station of Norderney
reached values between () and 18 m*s' (Fig. 3.2.6). Maximum values of daily
means correspond to a wind speed of no more than 8, which corresponds to a fresh
gale according to the Beaufort scale. A comparison of the weather stations at Norderney and Carolinensiel showed slight differences, so that the wind speed in the
observation area of ELA W A Twas 1-2 m*s" lower than those shown here,