

8.4 TOPOGRlD
217
8.4
A Grid-Based Approach Tailored to the Wadden Sea:
TOPOGRID
Based on the lessons learned from our first, "naive" model, a grid-based model
(TOPOGRID) is developed in the following which is tailored to the specific characteristics of the Wadden Sea, or of tidal flat ecosystems in general. The main difference between the first model and TOPOGRID is that with TOPOGRID the main deficiencies of the first models are avoided. However, it must be emphasized that our
focus is on the general concept of the model. Still, in the first version of TOPOGRID
which is presented here, extremely simplified assumptions are deliberately made.
TOPOGRID does therefore not claim to be realistic or to make testable predictions.
The aim of TOPOGRID is to show what a grid-based model of the macrozoobenthos
in the Wadden Sea would in principle have to look like.
Grid cell size and time steps
To make the simulation programme run fast enough, not the entire backbarrier
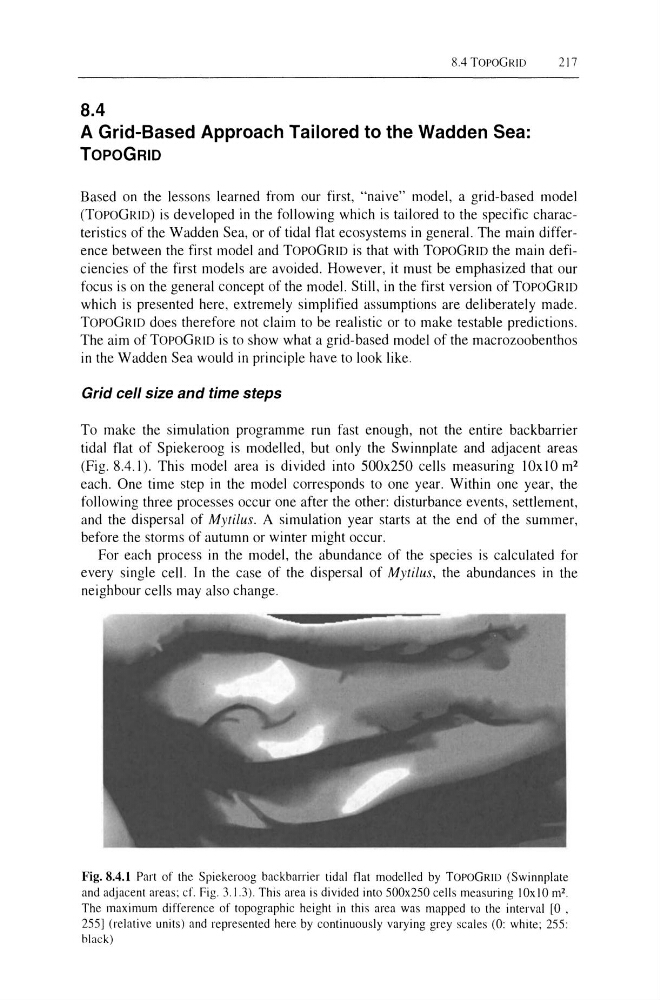
tidal flat of Spiekeroog is modelled, but only the Swinnplate and adjacent areas
(Fig. 8.4.1). This model area is divided into 500x250 cells measuring lOx 10m 2
each. One time step in the model corresponds to one year. Within one year, the
following three processes occur one after the other: disturbance events, settlement,
and the dispersal of Mytilus. A simulation year starts at the end of the summer,
before the storms of autumn or winter might occur.
For each process in the model, the abundance of the species is calculated for
every single cell. In the case of the dispersal of Mytilus, the abundances in the
neighbour cells may also change.
Fig. 8.4.1 Part of the Spiekeroog backbarrier tidal flat modelled by TOPOGRlD (Swinnplate
and adjacent areas; cf. Fig. 3.1.3). This area is divided into 500x250 cells measuring lOx 101112.
The maximum difference of topographic height in this area was mapped to the interval [0 ,
255] (relative units) and represented here by continuously varying grey scales (0: white; 255:
black)
217
8.4
A Grid-Based Approach Tailored to the Wadden Sea:
TOPOGRID
Based on the lessons learned from our first, "naive" model, a grid-based model
(TOPOGRID) is developed in the following which is tailored to the specific characteristics of the Wadden Sea, or of tidal flat ecosystems in general. The main difference between the first model and TOPOGRID is that with TOPOGRID the main deficiencies of the first models are avoided. However, it must be emphasized that our
focus is on the general concept of the model. Still, in the first version of TOPOGRID
which is presented here, extremely simplified assumptions are deliberately made.
TOPOGRID does therefore not claim to be realistic or to make testable predictions.
The aim of TOPOGRID is to show what a grid-based model of the macrozoobenthos
in the Wadden Sea would in principle have to look like.
Grid cell size and time steps
To make the simulation programme run fast enough, not the entire backbarrier
tidal flat of Spiekeroog is modelled, but only the Swinnplate and adjacent areas
(Fig. 8.4.1). This model area is divided into 500x250 cells measuring lOx 10m 2
each. One time step in the model corresponds to one year. Within one year, the
following three processes occur one after the other: disturbance events, settlement,
and the dispersal of Mytilus. A simulation year starts at the end of the summer,
before the storms of autumn or winter might occur.
For each process in the model, the abundance of the species is calculated for
every single cell. In the case of the dispersal of Mytilus, the abundances in the
neighbour cells may also change.
Fig. 8.4.1 Part of the Spiekeroog backbarrier tidal flat modelled by TOPOGRlD (Swinnplate
and adjacent areas; cf. Fig. 3.1.3). This area is divided into 500x250 cells measuring lOx 101112.
The maximum difference of topographic height in this area was mapped to the interval [0 ,
255] (relative units) and represented here by continuously varying grey scales (0: white; 255:
black)