

8.1 IntroductIon
213
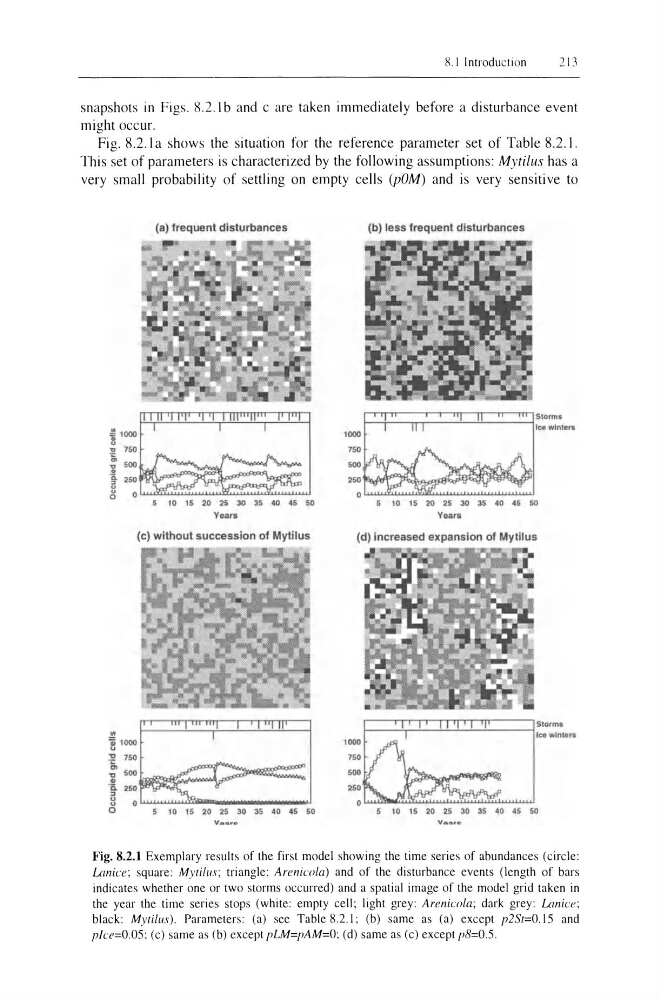
snapshots in Figs. R.2.1 band c are taken immediately before a disturbance event
might occur.
Fig. 8.2.1 a shows the situation for the reference parameter set of Table 8.2.1.
This set of parameters is characterized by the following assumptions: Mytilus has a
very small probability of settling on empty cells (POM) and is very sensitive to
(a) frequent disturbances
i'~r:=1 80~'"
5 10 15 20 25 30 35 40 45 SO
Years
(c) without succession of Mytilus
n~,1
o
5 10 15 20 25 30 35 40 4S 50
(b) less frequent disturbances
5 10 15 20 25 30 35 40 4S so
Years
(d) increased expansion of My til us
5 10 15 20 25 30 35 40 45 50
Fig. 8.2.1 Exemplary results of the first model showing the time series of abundances (circle:
Lanice; square: Mylilus; triangle: Arenicola) and of the disturbance events (length of bars
indicates whether one or two storms occurred) and a spatial image of the model grid taken in
the year the time series stops (white: empty cell; light grey: Arenicola; dark grey: Lanice;
black: Mylilus). Parameters: (a) see Table 8.2.1; (b) same as (a) except p2St=O. J 5 and
plce=O.05; (e) same as (b) except pLM=pAM=O; (d) same as (c) except p8=O.5.
213
snapshots in Figs. R.2.1 band c are taken immediately before a disturbance event
might occur.
Fig. 8.2.1 a shows the situation for the reference parameter set of Table 8.2.1.
This set of parameters is characterized by the following assumptions: Mytilus has a
very small probability of settling on empty cells (POM) and is very sensitive to
(a) frequent disturbances
i'~r:=1 80~'"
5 10 15 20 25 30 35 40 45 SO
Years
(c) without succession of Mytilus
n~,1
o
5 10 15 20 25 30 35 40 4S 50
(b) less frequent disturbances
5 10 15 20 25 30 35 40 4S so
Years
(d) increased expansion of My til us
5 10 15 20 25 30 35 40 45 50
Fig. 8.2.1 Exemplary results of the first model showing the time series of abundances (circle:
Lanice; square: Mylilus; triangle: Arenicola) and of the disturbance events (length of bars
indicates whether one or two storms occurred) and a spatial image of the model grid taken in
the year the time series stops (white: empty cell; light grey: Arenicola; dark grey: Lanice;
black: Mylilus). Parameters: (a) see Table 8.2.1; (b) same as (a) except p2St=O. J 5 and
plce=O.05; (e) same as (b) except pLM=pAM=O; (d) same as (c) except p8=O.5.