

lOX
5 SpatIal and Temporal Dlstnhulion Patterns
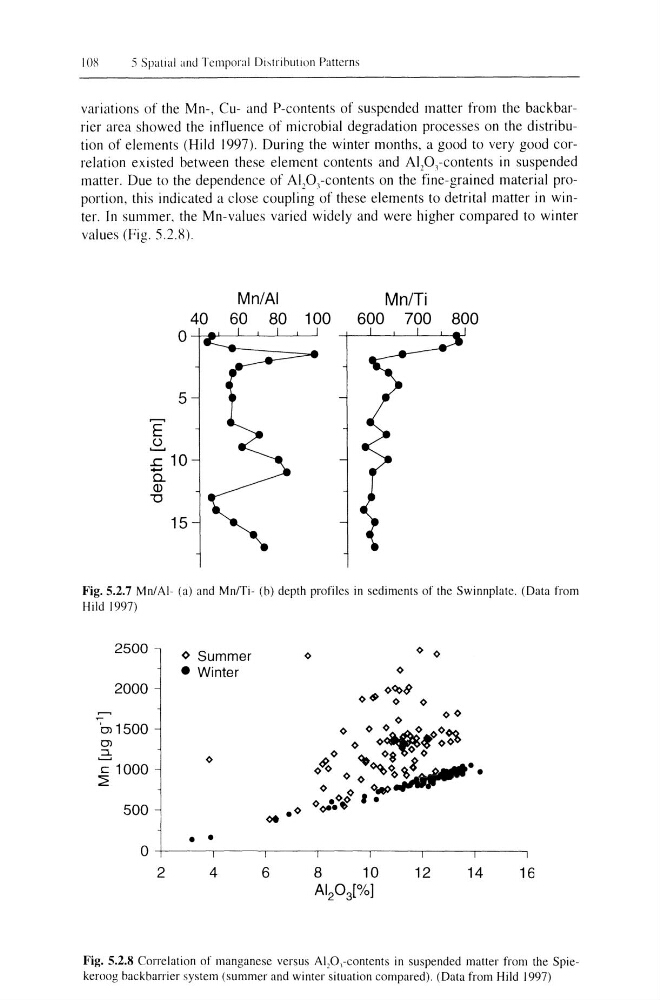
variations of the Mn-, Cu- and P-contents of suspended matter from the backbarrier area showed the intluence of microbial degradation processes on the distribution of elements (Hild 1997). During the winter months, a good to very good correlation existed between these element contents and Al 2 0 J -contents in suspended
matter. Due to the dependence of AlpJ-contents on the fine-grained material proportion, this indicated a close coupling of these elements to detrital matter in winter. In summer, the Mn-values varied widely and were higher compared to winter
values (Fig. 5.2.8).
~
E
2
Mn/AI
40 60 80 100
o -t-:;l..---'---'---'---'-----'
5
..c 10
+-'
0..
Q)
"0
15
MnlTi
600 700 800
Fig. 5.2.7 Mn/AI- (a) and Mn/Ti- (h) depth profiles in sediments of the Swinnplate. (Data from
Hild 1997)
2500
¢ Summer
<>
<> <>
• Winter
<>
2000
~ <>~~
<>
<> <>
'oJ 1500
<>
OJ
2;
c 1000
~
500
~ .<>
• •
0
2
4
6
8
10
12
14
16
AI 2 0 3 [%]
Fig. 5.2.8 Correlation of manganese versus AI,O,-contents in suspended matter from the Spiekeroog hackbarricr systcm (summer and winter situation compared). (Data from Hild 1997)
5 SpatIal and Temporal Dlstnhulion Patterns
variations of the Mn-, Cu- and P-contents of suspended matter from the backbarrier area showed the intluence of microbial degradation processes on the distribution of elements (Hild 1997). During the winter months, a good to very good correlation existed between these element contents and Al 2 0 J -contents in suspended
matter. Due to the dependence of AlpJ-contents on the fine-grained material proportion, this indicated a close coupling of these elements to detrital matter in winter. In summer, the Mn-values varied widely and were higher compared to winter
values (Fig. 5.2.8).
~
E
2
Mn/AI
40 60 80 100
o -t-:;l..---'---'---'---'-----'
5
..c 10
+-'
0..
Q)
"0
15
MnlTi
600 700 800
Fig. 5.2.7 Mn/AI- (a) and Mn/Ti- (h) depth profiles in sediments of the Swinnplate. (Data from
Hild 1997)
2500
¢ Summer
<>
<> <>
• Winter
<>
2000
~ <>~~
<>
<> <>
'oJ 1500
<>
OJ
2;
c 1000
~
500
~ .<>
• •
0
2
4
6
8
10
12
14
16
AI 2 0 3 [%]
Fig. 5.2.8 Correlation of manganese versus AI,O,-contents in suspended matter from the Spiekeroog hackbarricr systcm (summer and winter situation compared). (Data from Hild 1997)