

102
5 SpatIal and Temporal Distnhutlon Patterns
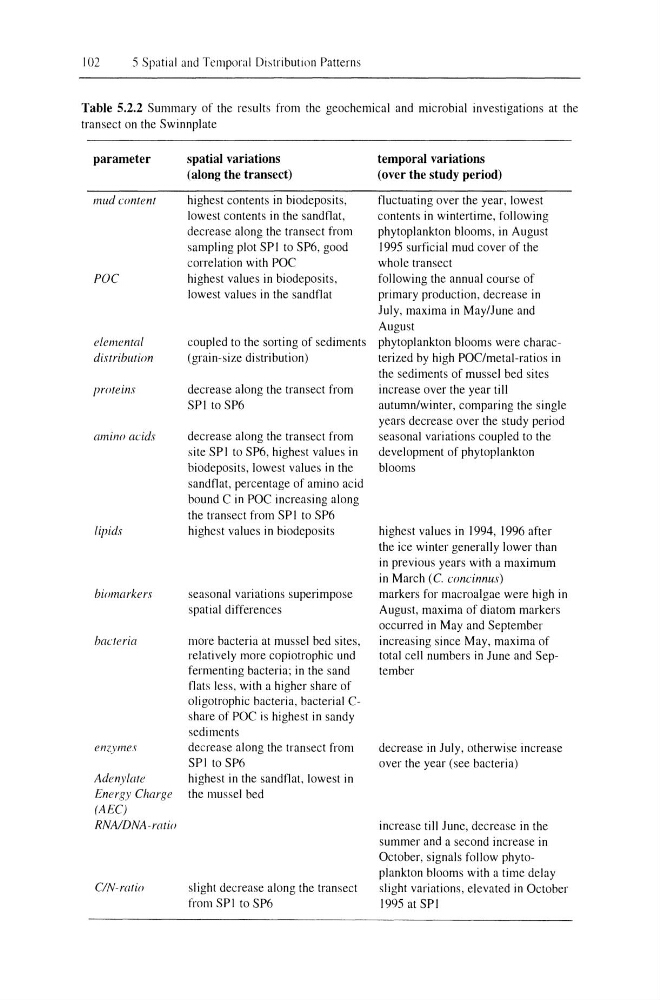
Table 5.2.2 Summary of the results from the geochemical and microhial investigations at the
transect on the Swinnplate
parameter
mud content
POC
elemental
distribution
proteins
amino acids
lipids
hiomarke rs
bacteria
enZyl11es
Adcnyla/c
Energy Charge
(AEC)
RNA/DNA -ratio
CIN-mtio
spatial variations
(along the transect)
highest contents in hiodeposits,
lowest contents in the sandflat,
decrease along the transect from
sampling plot SPI to SP6, good
correlation with POC
highest values in biodeposits,
lowest values in the sandflat
coupled to the sorting of sediments
(grain-size distribution)
decrease along the transect from
SPI to SP6
decrease along the transect from
site SPI to SP6, highest values in
hiodeposits, lowest values in the
sandflat, percentage of amino acid
hound C in POC increasing along
the transect from SP I to SP6
highest values in hiodeposits
seasonal variations superimpose
spatial differences
more hacteria at mussel bed sites,
relatively more copiotrophic und
fermenting bacteria; in the sand
flats less, with a higher share of
oligotrophic bacteria, hacterial Cshare of POC is highest in sandy
sediments
decrease along the transect from
SPI to SP6
highest in the sandflat, lowest in
the mussel bed
slight decrease along the transect
from SPI to SP6
temporal variations
(over the study period)
fluctuating over the year, lowest
contents in wintertime, following
phytoplankton hlooms, in August
1995 surficial mud cover of the
whole transect
following the annual course of
primary production, decrease in
July, maxima in May/June and
August
phytoplankton blooms were characterized by high POC/metal-ratios in
the sediments of mussel bed sites
increase over the year till
autumn/winter, comparing the single
years decrease over the study period
seasonal variations coupled to the
development of phytoplankton
hlooms
highest values in 1994, 1996 after
the ice winter generally lower than
in previous years with a maximum
in March (c. concinnus)
markers for macroalgae were high in
August, maxima of diatom markers
occurred in May and September
increasing since May, maxima of
total cell numbers in June and September
decrease in July, otherwise increase
over the year (see bacteria)
increase till June, decrease in the
summer and a second increase in
October, signals follow phytoplankton blooms with a time delay
slight variations, elevated in October
1995 at SPI
5 SpatIal and Temporal Distnhutlon Patterns
Table 5.2.2 Summary of the results from the geochemical and microhial investigations at the
transect on the Swinnplate
parameter
mud content
POC
elemental
distribution
proteins
amino acids
lipids
hiomarke rs
bacteria
enZyl11es
Adcnyla/c
Energy Charge
(AEC)
RNA/DNA -ratio
CIN-mtio
spatial variations
(along the transect)
highest contents in hiodeposits,
lowest contents in the sandflat,
decrease along the transect from
sampling plot SPI to SP6, good
correlation with POC
highest values in biodeposits,
lowest values in the sandflat
coupled to the sorting of sediments
(grain-size distribution)
decrease along the transect from
SPI to SP6
decrease along the transect from
site SPI to SP6, highest values in
hiodeposits, lowest values in the
sandflat, percentage of amino acid
hound C in POC increasing along
the transect from SP I to SP6
highest values in hiodeposits
seasonal variations superimpose
spatial differences
more hacteria at mussel bed sites,
relatively more copiotrophic und
fermenting bacteria; in the sand
flats less, with a higher share of
oligotrophic bacteria, hacterial Cshare of POC is highest in sandy
sediments
decrease along the transect from
SPI to SP6
highest in the sandflat, lowest in
the mussel bed
slight decrease along the transect
from SPI to SP6
temporal variations
(over the study period)
fluctuating over the year, lowest
contents in wintertime, following
phytoplankton hlooms, in August
1995 surficial mud cover of the
whole transect
following the annual course of
primary production, decrease in
July, maxima in May/June and
August
phytoplankton blooms were characterized by high POC/metal-ratios in
the sediments of mussel bed sites
increase over the year till
autumn/winter, comparing the single
years decrease over the study period
seasonal variations coupled to the
development of phytoplankton
hlooms
highest values in 1994, 1996 after
the ice winter generally lower than
in previous years with a maximum
in March (c. concinnus)
markers for macroalgae were high in
August, maxima of diatom markers
occurred in May and September
increasing since May, maxima of
total cell numbers in June and September
decrease in July, otherwise increase
over the year (see bacteria)
increase till June, decrease in the
summer and a second increase in
October, signals follow phytoplankton blooms with a time delay
slight variations, elevated in October
1995 at SPI