

220
In contrast, population growth (P4) and structure
(P6) were mainly infl uenced by endogenous processes (mainly variability in natural mortality
and migration). The variations observed in the
corresponding metrics thus refl ected the infl uence of these processes rather than the effect of
management. They are good indicators of the
conditions experienced by the population, but no
conclusion on management performance could
be drawn from their values. High sensitivity
indices related to uncertainties are indication of
a lack of robustness of the metric (Lehuta et al.
2013b ). They point out the sources of uncertainty that need to be reduced to allow the use of
the metric as an indicator. More generally, the
sensitivity of performance metrics to factors
other than management measures should warn
managers about the potential misinterpretation
of “good values” as good management performance and stress the need for completing the
vision with robust metrics of management
impact.
References
Ainsworth CH, Samhouri JF, Busch DS et al (2011)
Potential impacts of climate change on Northeast
Pacifi c marine food webs and fi sheries. ICES J Mar
Sci 68:1217–1229
Albouy C, Guilhaumon F, Villéger S et al (2011)
Predicting trophic guild and diet overlap from functional traits: statistics, opportunities and limitations
for marine ecology. Mar Ecol Prog Ser 436:17–28
Banaru D, Mellon-Duval C, Roos D et al (2013) Trophic
structure in the Gulf of Lions marine ecosystem
(north-western Mediterranean Sea) and fi shing
impacts. J Mar Syst 111:45–68
Bremner J, Rogers SI, Frid CLJ (2003) Assessing functional
diversity in marine benthic ecosystems: a comparison of
approaches. Mar Ecol Prog Ser 254:11–25
Caddy JF, Refk R, Do-Chi T (1995) Productivity estimates for the Mediterranean: evidence of accelerating
ecological change. Ocean Coast Manag 26:1–18
Coll M, Piroddi C, Steenbeek J et al (2010) The biodiversity of the Mediterranean Sea: estimates, patterns, and
threats. PLoS ONE 5:e11842
Coll M, Piroddi C, Albouy C et al (2012) The
Mediterranean Sea under siege: spatial overlap
between marine biodiversity, cumulative threats and
marine reserves. Glob Ecol Biogeogr 21:465–480
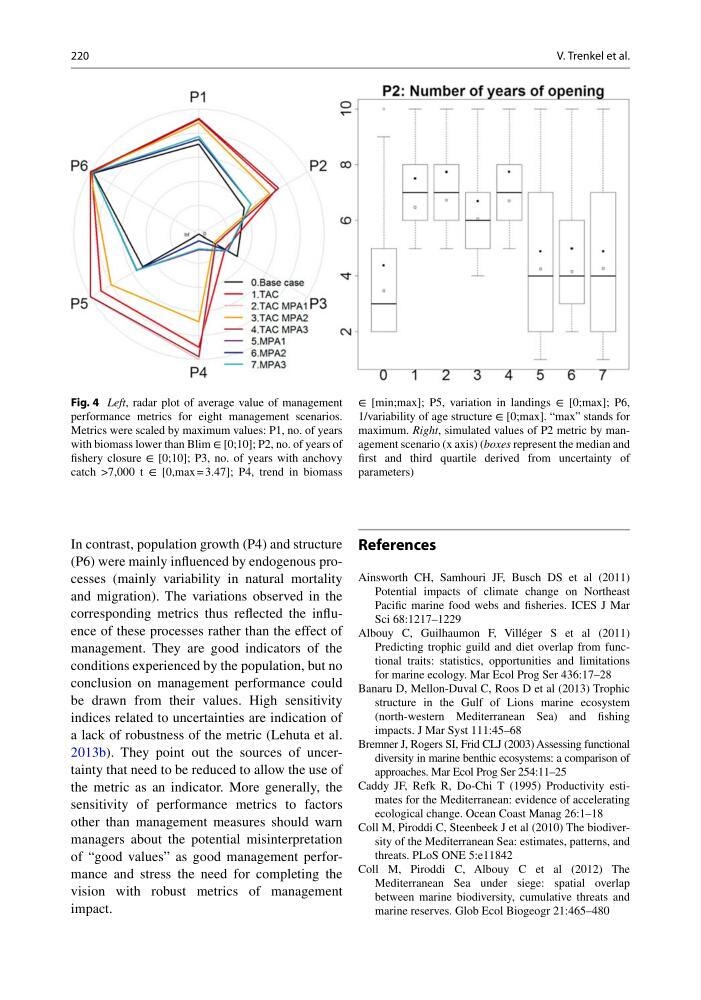
Fig. 4 Left , radar plot of average value of management
performance metrics for eight management scenarios.
Metrics were scaled by maximum values: P1, no. of years
with biomass lower than Blim ∈ [0;10]; P2, no. of years of
fi shery closure ∈ [0;10]; P3, no. of years with anchovy
catch >7,000 t ∈ [0,max = 3.47]; P4, trend in biomass
∈ [min;max]; P5, variation in landings ∈ [0;max]; P6,
1/variability of age structure ∈ [0;max]. “max” stands for
maximum. Right , simulated values of P2 metric by management scenario (x axis) ( boxes represent the median and
fi rst and third quartile derived from uncertainty of
parameters)
V. Trenkel et al.
In contrast, population growth (P4) and structure
(P6) were mainly infl uenced by endogenous processes (mainly variability in natural mortality
and migration). The variations observed in the
corresponding metrics thus refl ected the infl uence of these processes rather than the effect of
management. They are good indicators of the
conditions experienced by the population, but no
conclusion on management performance could
be drawn from their values. High sensitivity
indices related to uncertainties are indication of
a lack of robustness of the metric (Lehuta et al.
2013b ). They point out the sources of uncertainty that need to be reduced to allow the use of
the metric as an indicator. More generally, the
sensitivity of performance metrics to factors
other than management measures should warn
managers about the potential misinterpretation
of “good values” as good management performance and stress the need for completing the
vision with robust metrics of management
impact.
References
Ainsworth CH, Samhouri JF, Busch DS et al (2011)
Potential impacts of climate change on Northeast
Pacifi c marine food webs and fi sheries. ICES J Mar
Sci 68:1217–1229
Albouy C, Guilhaumon F, Villéger S et al (2011)
Predicting trophic guild and diet overlap from functional traits: statistics, opportunities and limitations
for marine ecology. Mar Ecol Prog Ser 436:17–28
Banaru D, Mellon-Duval C, Roos D et al (2013) Trophic
structure in the Gulf of Lions marine ecosystem
(north-western Mediterranean Sea) and fi shing
impacts. J Mar Syst 111:45–68
Bremner J, Rogers SI, Frid CLJ (2003) Assessing functional
diversity in marine benthic ecosystems: a comparison of
approaches. Mar Ecol Prog Ser 254:11–25
Caddy JF, Refk R, Do-Chi T (1995) Productivity estimates for the Mediterranean: evidence of accelerating
ecological change. Ocean Coast Manag 26:1–18
Coll M, Piroddi C, Steenbeek J et al (2010) The biodiversity of the Mediterranean Sea: estimates, patterns, and
threats. PLoS ONE 5:e11842
Coll M, Piroddi C, Albouy C et al (2012) The
Mediterranean Sea under siege: spatial overlap
between marine biodiversity, cumulative threats and
marine reserves. Glob Ecol Biogeogr 21:465–480
Fig. 4 Left , radar plot of average value of management
performance metrics for eight management scenarios.
Metrics were scaled by maximum values: P1, no. of years
with biomass lower than Blim ∈ [0;10]; P2, no. of years of
fi shery closure ∈ [0;10]; P3, no. of years with anchovy
catch >7,000 t ∈ [0,max = 3.47]; P4, trend in biomass
∈ [min;max]; P5, variation in landings ∈ [0;max]; P6,
1/variability of age structure ∈ [0;max]. “max” stands for
maximum. Right , simulated values of P2 metric by management scenario (x axis) ( boxes represent the median and
fi rst and third quartile derived from uncertainty of
parameters)
V. Trenkel et al.