

18
2 Genetic Resources: Status, Development, Losses, and Conservation
it must be questioned whether the same relationship can be utilized for plants as
for animals. Because of different population dynamics and area requirements, it
seems that the predicted overall estimates could be reduced even further for
estimated plant extinction rates (Groombridge, 1992). Although the majority of
terrestrial species are derived from the tropical forests, it seems insufficient to
calculate the overall extinction rate of plant species based only upon the further
development of the tropical rain forests.
Jenkins (1992) points out that species richness as well as habitat destruction in
the forests is not distributed evenly. As shown by Dobson et aI., the fact of the
"hot spots" of potential extinction must be reflected in these calculations. After
examining patterns of geographical distribution of 924 threatened and endangered
plant and animal species in 2,858 U.S. counties, Dobson et ai. came to the
conclusion that most endangered species in the U.S.A. are only found in relatively
few critical geographical areas - the "hot spots" of potential extinction (1997).
Furthermore, the estimates assume that forest conversion means total habitat
destruction. Taking the different conversion possibilities mentioned above into
account, the habitats are, however, often modified without resulting in the total
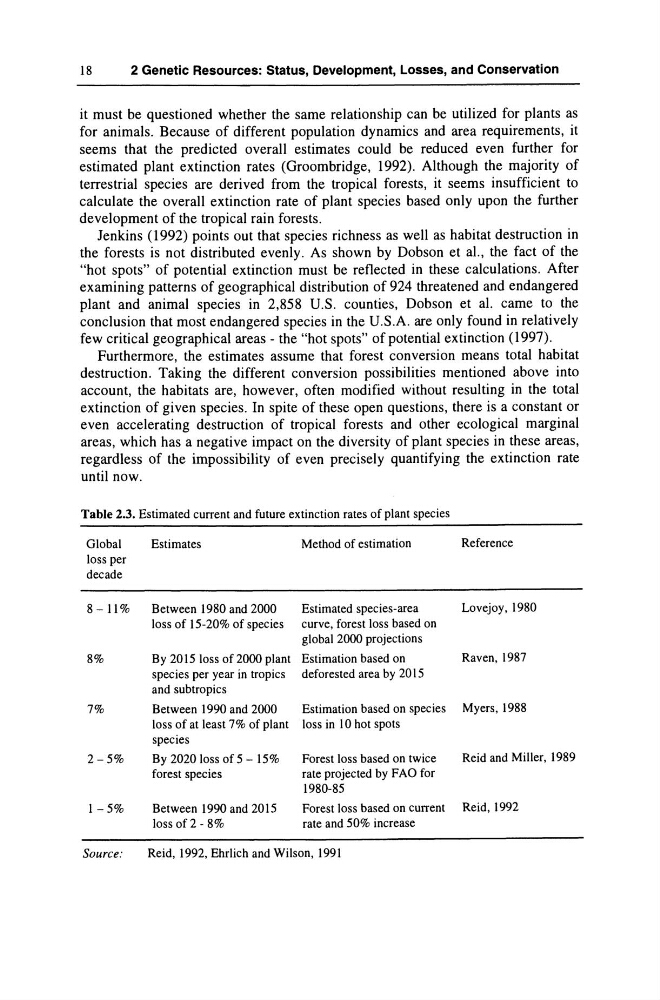
extinction of given species. In spite of these open questions, there is a constant or
even accelerating destruction of tropical forests and other ecological marginal
areas, which has a negative impact on the diversity of plant species in these areas,
regardless of the impossibility of even precisely quantifying the extinction rate
until now.
Table 2.3. Estimated current and future extinction rates of plant species
Global
Estimates
Method of estimation
Reference
loss per
decade
8 -11%
Between 1980 and 2000
Estimated species-area
Lovejoy, 1980
loss of 15-20% of species curve, forest loss based on
global 2000 projections
8%
By 2015 loss of 2000 plant Estimation based on
Raven, 1987
species per year in tropics deforested area by 2015
and subtropics
7%
Between 1990 and 2000
Estimation based on species Myers, 1988
loss of at least 7% of plant loss in 10 hot spots
species
2-5%
By 2020 loss of 5 - 15%
Forest loss based on twice
Reid and Miller, 1989
forest species
rate projected by FAO for
1980-85
1-5%
Between 1990 and 2015
Forest loss based on current Reid,1992
loss of2 - 8%
rate and 50% increase
Source:
Reid, 1992, Ehrlich and Wilson, 1991
2 Genetic Resources: Status, Development, Losses, and Conservation
it must be questioned whether the same relationship can be utilized for plants as
for animals. Because of different population dynamics and area requirements, it
seems that the predicted overall estimates could be reduced even further for
estimated plant extinction rates (Groombridge, 1992). Although the majority of
terrestrial species are derived from the tropical forests, it seems insufficient to
calculate the overall extinction rate of plant species based only upon the further
development of the tropical rain forests.
Jenkins (1992) points out that species richness as well as habitat destruction in
the forests is not distributed evenly. As shown by Dobson et aI., the fact of the
"hot spots" of potential extinction must be reflected in these calculations. After
examining patterns of geographical distribution of 924 threatened and endangered
plant and animal species in 2,858 U.S. counties, Dobson et ai. came to the
conclusion that most endangered species in the U.S.A. are only found in relatively
few critical geographical areas - the "hot spots" of potential extinction (1997).
Furthermore, the estimates assume that forest conversion means total habitat
destruction. Taking the different conversion possibilities mentioned above into
account, the habitats are, however, often modified without resulting in the total
extinction of given species. In spite of these open questions, there is a constant or
even accelerating destruction of tropical forests and other ecological marginal
areas, which has a negative impact on the diversity of plant species in these areas,
regardless of the impossibility of even precisely quantifying the extinction rate
until now.
Table 2.3. Estimated current and future extinction rates of plant species
Global
Estimates
Method of estimation
Reference
loss per
decade
8 -11%
Between 1980 and 2000
Estimated species-area
Lovejoy, 1980
loss of 15-20% of species curve, forest loss based on
global 2000 projections
8%
By 2015 loss of 2000 plant Estimation based on
Raven, 1987
species per year in tropics deforested area by 2015
and subtropics
7%
Between 1990 and 2000
Estimation based on species Myers, 1988
loss of at least 7% of plant loss in 10 hot spots
species
2-5%
By 2020 loss of 5 - 15%
Forest loss based on twice
Reid and Miller, 1989
forest species
rate projected by FAO for
1980-85
1-5%
Between 1990 and 2015
Forest loss based on current Reid,1992
loss of2 - 8%
rate and 50% increase
Source:
Reid, 1992, Ehrlich and Wilson, 1991