

12
2 Genetic Resources: Status, Development, Losses, and Conservation
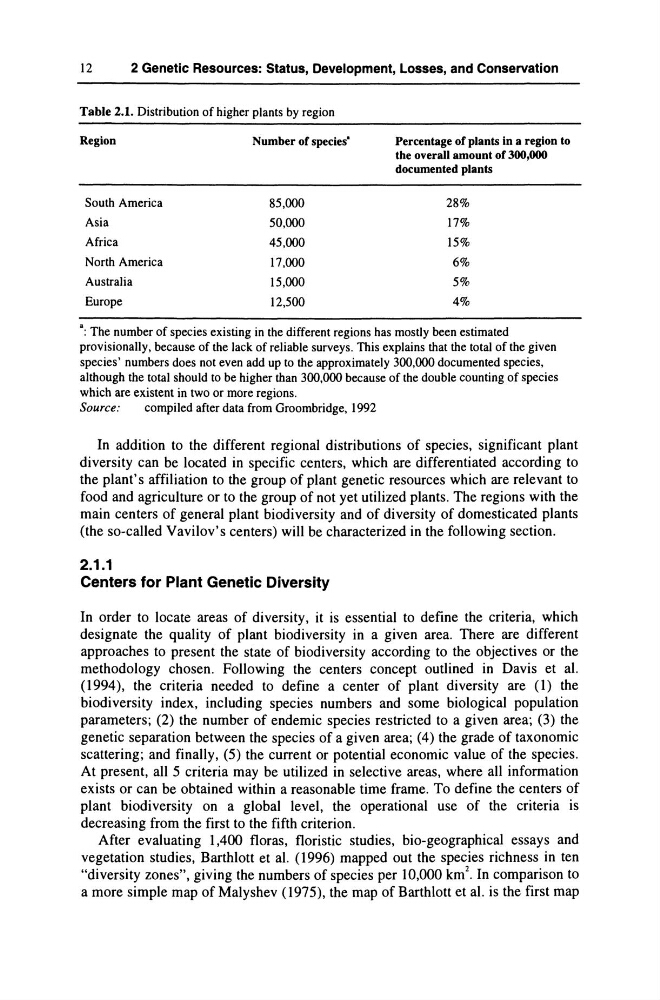
Table 2.1. Distribution of higher plants by region
Region
Number of species'
South America
85,000
Asia
50,000
Africa
45,000
North America
17,000
Australia
15,000
Europe
12,500
Percentage of plants in a region to
the overall amount of 300,000
documented plants
28%
17%
15%
6%
5%
4%
a: The number of species existing in the different regions has mostly been estimated
provisionally, because of the lack of reliable surveys. This explains that the total of the given
species' numbers does not even add up to the approximately 300,000 documented species,
although the total should to be higher than 300,000 because of the double counting of species
which are existent in two or more regions.
Source:
compiled after data from Groombridge, 1992
In addition to the different regional distributions of species, significant plant
diversity can be located in specific centers, which are differentiated according to
the plant's affiliation to the group of plant genetic resources which are relevant to
food and agriculture or to the group of not yet utilized plants. The regions with the
main centers of general plant biodiversity and of diversity of domesticated plants
(the so-called VaviIov's centers) will be characterized in the following section.
2.1.1
Centers for Plant Genetic Diversity
In order to locate areas of diversity, it is essential to define the criteria, which
designate the quality of plant biodiversity in a given area. There are different
approaches to present the state of biodiversity according to the objectives or the
methodology chosen. Following the centers concept outlined in Davis et aI.
(1994), the criteria needed to define a center of plant diversity are (1) the
biodiversity index, including species numbers and some biological population
parameters; (2) the number of endemic species restricted to a given area; (3) the
genetic separation between the species of a given area; (4) the grade of taxonomic
scattering; and finally, (5) the current or potential economic value of the species.
At present, all 5 criteria may be utilized in selective areas, where all information
exists or can be obtained within a reasonable time frame. To define the centers of
plant biodiversity on a global level, the operational use of the criteria is
decreasing from the first to the fifth criterion.
After evaluating 1,400 floras, floristic studies, bio-geographical essays and
vegetation studies, Barthlott et al. (1996) mapped out the species richness in ten
"diversity zones", giving the numbers of species per 10,000 km 2 • In comparison to
a more simple map of Malyshev (1975), the map of Barthlott et al. is the first map
2 Genetic Resources: Status, Development, Losses, and Conservation
Table 2.1. Distribution of higher plants by region
Region
Number of species'
South America
85,000
Asia
50,000
Africa
45,000
North America
17,000
Australia
15,000
Europe
12,500
Percentage of plants in a region to
the overall amount of 300,000
documented plants
28%
17%
15%
6%
5%
4%
a: The number of species existing in the different regions has mostly been estimated
provisionally, because of the lack of reliable surveys. This explains that the total of the given
species' numbers does not even add up to the approximately 300,000 documented species,
although the total should to be higher than 300,000 because of the double counting of species
which are existent in two or more regions.
Source:
compiled after data from Groombridge, 1992
In addition to the different regional distributions of species, significant plant
diversity can be located in specific centers, which are differentiated according to
the plant's affiliation to the group of plant genetic resources which are relevant to
food and agriculture or to the group of not yet utilized plants. The regions with the
main centers of general plant biodiversity and of diversity of domesticated plants
(the so-called VaviIov's centers) will be characterized in the following section.
2.1.1
Centers for Plant Genetic Diversity
In order to locate areas of diversity, it is essential to define the criteria, which
designate the quality of plant biodiversity in a given area. There are different
approaches to present the state of biodiversity according to the objectives or the
methodology chosen. Following the centers concept outlined in Davis et aI.
(1994), the criteria needed to define a center of plant diversity are (1) the
biodiversity index, including species numbers and some biological population
parameters; (2) the number of endemic species restricted to a given area; (3) the
genetic separation between the species of a given area; (4) the grade of taxonomic
scattering; and finally, (5) the current or potential economic value of the species.
At present, all 5 criteria may be utilized in selective areas, where all information
exists or can be obtained within a reasonable time frame. To define the centers of
plant biodiversity on a global level, the operational use of the criteria is
decreasing from the first to the fifth criterion.
After evaluating 1,400 floras, floristic studies, bio-geographical essays and
vegetation studies, Barthlott et al. (1996) mapped out the species richness in ten
"diversity zones", giving the numbers of species per 10,000 km 2 • In comparison to
a more simple map of Malyshev (1975), the map of Barthlott et al. is the first map