

118
5 Conservation Costs of PGRFA
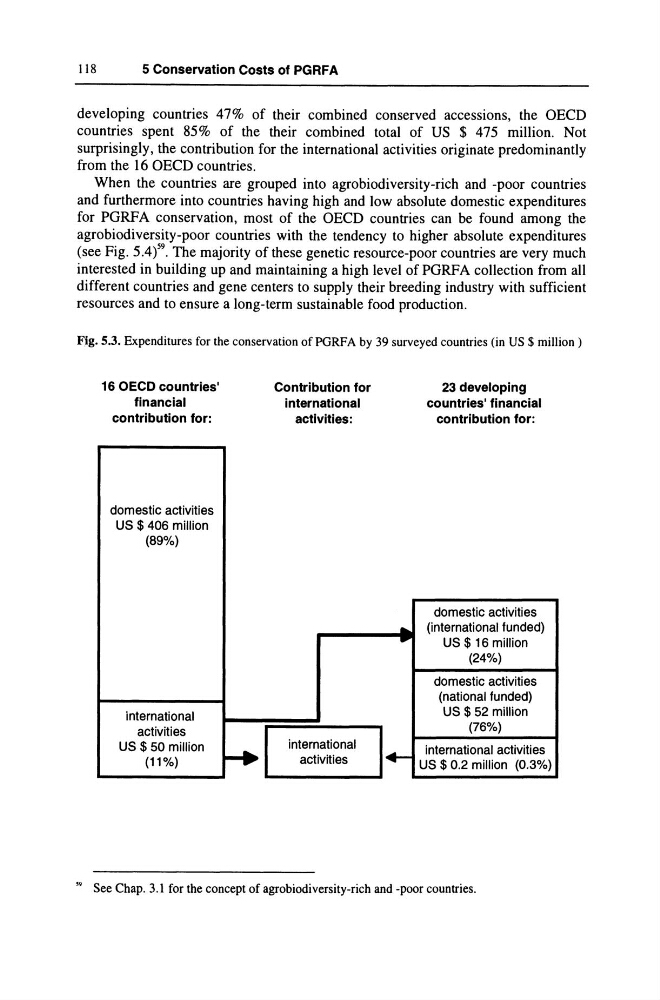
developing countries 47% of their combined conserved accessions, the OEeD
countries spent 85% of the their combined total of US $ 475 million. Not
surprisingly, the contribution for the international activities originate predominantly
from the 16 OEeD countries.
When the countries are grouped into agrobiodiversity-rich and -poor countries
and furthermore into countries having high and low absolute domestic expenditures
for PGRFA conservation, most of the OEeD countries can be found among the
agrobiodiversity-poor countries with the tendency to higher absolute expenditures
(see Fig. 5.4)59. The majority of these genetic resource-poor countries are very much
interested in building up and maintaining a high level of PGRFA collection from all
different countries and gene centers to supply their breeding industry with sufficient
resources and to ensure a long-term sustainable food production.
Fig. 5.3. Expenditures for the conservation ofPGRFA by 39 surveyed countries (in US $ million)
16 OECD countries'
financial
contribution for:
domestic activities
US $ 406 million
(89%)
international
activities
US $ 50 million
(11%)
f-+
Contribution for
international
activities:
international
activities
.. ....
I+23 developing
countries' financial
contribution for:
domestic activities
(international funded)
US $ 16 million
(24%)
domestic activities
(national funded)
US $52 million
(76%)
international activities
US $ 0.2 million (0.3%)
" See Chap. 3.1 for the concept of agrobiodiversity-rich and -poor countries.
5 Conservation Costs of PGRFA
developing countries 47% of their combined conserved accessions, the OEeD
countries spent 85% of the their combined total of US $ 475 million. Not
surprisingly, the contribution for the international activities originate predominantly
from the 16 OEeD countries.
When the countries are grouped into agrobiodiversity-rich and -poor countries
and furthermore into countries having high and low absolute domestic expenditures
for PGRFA conservation, most of the OEeD countries can be found among the
agrobiodiversity-poor countries with the tendency to higher absolute expenditures
(see Fig. 5.4)59. The majority of these genetic resource-poor countries are very much
interested in building up and maintaining a high level of PGRFA collection from all
different countries and gene centers to supply their breeding industry with sufficient
resources and to ensure a long-term sustainable food production.
Fig. 5.3. Expenditures for the conservation ofPGRFA by 39 surveyed countries (in US $ million)
16 OECD countries'
financial
contribution for:
domestic activities
US $ 406 million
(89%)
international
activities
US $ 50 million
(11%)
f-+
Contribution for
international
activities:
international
activities
.. ....
I+23 developing
countries' financial
contribution for:
domestic activities
(international funded)
US $ 16 million
(24%)
domestic activities
(national funded)
US $52 million
(76%)
international activities
US $ 0.2 million (0.3%)
" See Chap. 3.1 for the concept of agrobiodiversity-rich and -poor countries.