

699
Chlorophylls and their Degradation in Nature
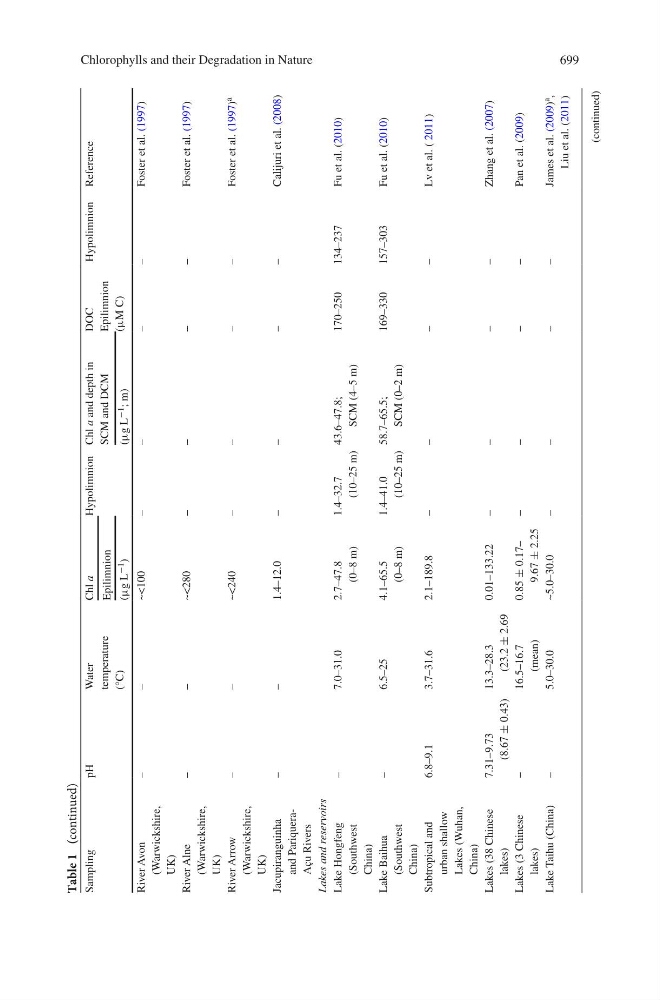
Sampling
pH
Water
temperature
(°C)
Chl a
Hypolimnion
Chl a
and depth in
SCM and DCM
DOC
Epilimnion
(μM C)
Hypolimnion Reference
Epilimnion
(μg L
−1 )
(μg L
−1 ; m)
River Avon
(Warwickshire,
UK)
–
–
~<100
–
–
–
–
Foster et al. (1997)
River Alne
(Warwickshire,
UK)
–
–
~<280
–
–
–
–
Foster et al. (1997)
River Arrow
(Warwickshire,
UK)
–
–
~<240
–
–
–
–
Foster et al. (1997) a
Jacupiranguinha
and PariqueraAçu Rivers
–
–
1.4–12.0
–
–
–
–
Calijuri et al. (2008)
Lakes and reservoirs
Lake Hongfeng
(Southwest
China)
–
7.0–31.0
2.7–47.8
(0–8 m)
1.4–32.7
(10–25 m)
43.6–47.8;
SCM (4–5 m)
170–250
134–237
Fu et al. (2010)
Lake Baihua
(Southwest
China)
–
6.5–25
4.1–65.5
(0–8 m)
1.4–41.0
(10–25 m)
58.7–65.5;
SCM (0–2 m)
169–330
157–303
Fu et al. (2010)
Subtropical and
urban shallow
Lakes (Wuhan,
China)
6.8–9.1
3.7–31.6
2.1–189.8
–
–
–
–
Lv et al. ( 2011)
Lakes (38 Chinese
lakes)
7.31–9.73
(8.67
± 0.43)
13.3–28.3
(23.2
± 2.69
0.01–133.22
–
–
–
–
Zhang et al. (2007)
Lakes (3 Chinese
lakes)
–
16.5–16.7
(mean)
0.85
± 0.17–
9.67
± 2.25
–
–
–
–
Pan et al. (2009)
Lake Taihu (China)
–
5.0–30.0
~5.0–30.0
–
–
–
–
James et al. (2009) a
,
Liu et al. (2011)
(continued)
Table 1 (continued)